
diff options
| author | CoprDistGit <infra@openeuler.org> | 2023-05-05 11:12:38 +0000 |
|---|---|---|
| committer | CoprDistGit <infra@openeuler.org> | 2023-05-05 11:12:38 +0000 |
| commit | 4038422993ac06b4dd59779bbd2ba878302fbc7b (patch) | |
| tree | 10d93d849cf1af455d3f6145975271745d596b46 /python-bar-chart-race.spec | |
| parent | 1626ed9fb1b45251e130447aecdd8a172973e5de (diff) | |
automatic import of python-bar-chart-raceopeneuler20.03
Diffstat (limited to 'python-bar-chart-race.spec')
| -rw-r--r-- | python-bar-chart-race.spec | 383 |
1 files changed, 383 insertions, 0 deletions
diff --git a/python-bar-chart-race.spec b/python-bar-chart-race.spec new file mode 100644 index 0000000..ad8c7f8 --- /dev/null +++ b/python-bar-chart-race.spec @@ -0,0 +1,383 @@ +%global _empty_manifest_terminate_build 0 +Name: python-bar-chart-race +Version: 0.1.0 +Release: 1 +Summary: Create animated bar chart races using matplotlib +License: MIT +URL: https://github.com/dexplo/bar_chart_race +Source0: https://mirrors.nju.edu.cn/pypi/web/packages/95/de/a7143a557e82e28310f4ca6eb7d42f6bfd76dcf7bb731ae58a41afb8b330/bar_chart_race-0.1.0.tar.gz +BuildArch: noarch + +Requires: python3-pandas +Requires: python3-matplotlib + +%description +# Bar Chart Race + +[](https://pypi.org/project/bar_chart_race) +[](LICENSE) + +Make animated bar chart races in Python with matplotlib. + + + +## Official Documentation + +Visit the [bar_chart_race official documentation](https://www.dexplo.org/bar_chart_race) for detailed usage instructions. + +## Installation + +Install with either: + +* `pip install bar_chart_race` +* `conda install -c conda-forge bar_chart_race` + +## Quickstart + +Must begin with a pandas DataFrame containing 'wide' data where: + +* Every row represents a single period of time +* Each column holds the value for a particular category +* The index contains the time component (optional) + +The data below is an example of properly formatted data. It shows total deaths from COVID-19 for several countries by date. + + + +### Main function - `bar_chart_race` + +There is one main function, **`bar_chart_race`**, which we use to recreate the above video. All parameters are shown with their default value except for `filename` and `title`. + +```python +import bar_chart_race as bcr +df = bcr.load_dataset('covid19_tutorial') +bcr.bar_chart_race( + df=df, + filename='covid19_horiz.mp4', + orientation='h', + sort='desc', + n_bars=6, + fixed_order=False, + fixed_max=True, + steps_per_period=10, + interpolate_period=False, + label_bars=True, + bar_size=.95, + period_label={'x': .99, 'y': .25, 'ha': 'right', 'va': 'center'}, + period_fmt='%B %d, %Y', + period_summary_func=lambda v, r: {'x': .99, 'y': .18, + 's': f'Total deaths: {v.nlargest(6).sum():,.0f}', + 'ha': 'right', 'size': 8, 'family': 'Courier New'}, + perpendicular_bar_func='median', + period_length=500, + figsize=(5, 3), + dpi=144, + cmap='dark12', + title='COVID-19 Deaths by Country', + title_size='', + bar_label_size=7, + tick_label_size=7, + shared_fontdict={'family' : 'Helvetica', 'color' : '.1'}, + scale='linear', + writer=None, + fig=None, + bar_kwargs={'alpha': .7}, + filter_column_colors=False) +``` + +### Save animation to disk or return HTML + +Leave the `filename` parameter as `None` to return the animation as HTML. If you are running a Jupyter Notebook, it will automatically be embedded into it. + +```python +bcr.bar_chart_race(df=df, filename=None) +``` + +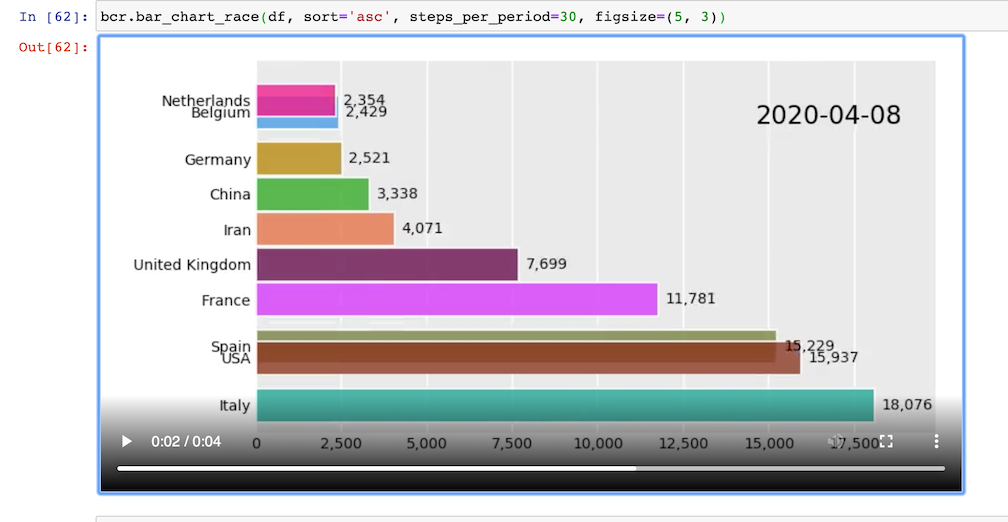 + +### Customization + +There are many options to customize the bar chart race to get the animation you desire. Below, we have an animation where the maximum x-value and order of the bars are set for the entire duration. A custom summary label and perpendicular bar of median is also added. + +```python +def period_summary(values, ranks): + top2 = values.nlargest(2) + leader = top2.index[0] + lead = top2.iloc[0] - top2.iloc[1] + s = f'{leader} by {lead:.0f}' + return {'s': s, 'x': .95, 'y': .07, 'ha': 'right', 'size': 8} + +bcr.bar_chart_race(df_baseball, period_length=1000, + fixed_max=True, fixed_order=True, n_bars=10, + figsize=(5, 3), period_fmt='Season {x:,.0f}', + title='Top 10 Home Run Hitters by Season Played') +``` + + + + + +%package -n python3-bar-chart-race +Summary: Create animated bar chart races using matplotlib +Provides: python-bar-chart-race +BuildRequires: python3-devel +BuildRequires: python3-setuptools +BuildRequires: python3-pip +%description -n python3-bar-chart-race +# Bar Chart Race + +[](https://pypi.org/project/bar_chart_race) +[](LICENSE) + +Make animated bar chart races in Python with matplotlib. + + + +## Official Documentation + +Visit the [bar_chart_race official documentation](https://www.dexplo.org/bar_chart_race) for detailed usage instructions. + +## Installation + +Install with either: + +* `pip install bar_chart_race` +* `conda install -c conda-forge bar_chart_race` + +## Quickstart + +Must begin with a pandas DataFrame containing 'wide' data where: + +* Every row represents a single period of time +* Each column holds the value for a particular category +* The index contains the time component (optional) + +The data below is an example of properly formatted data. It shows total deaths from COVID-19 for several countries by date. + + + +### Main function - `bar_chart_race` + +There is one main function, **`bar_chart_race`**, which we use to recreate the above video. All parameters are shown with their default value except for `filename` and `title`. + +```python +import bar_chart_race as bcr +df = bcr.load_dataset('covid19_tutorial') +bcr.bar_chart_race( + df=df, + filename='covid19_horiz.mp4', + orientation='h', + sort='desc', + n_bars=6, + fixed_order=False, + fixed_max=True, + steps_per_period=10, + interpolate_period=False, + label_bars=True, + bar_size=.95, + period_label={'x': .99, 'y': .25, 'ha': 'right', 'va': 'center'}, + period_fmt='%B %d, %Y', + period_summary_func=lambda v, r: {'x': .99, 'y': .18, + 's': f'Total deaths: {v.nlargest(6).sum():,.0f}', + 'ha': 'right', 'size': 8, 'family': 'Courier New'}, + perpendicular_bar_func='median', + period_length=500, + figsize=(5, 3), + dpi=144, + cmap='dark12', + title='COVID-19 Deaths by Country', + title_size='', + bar_label_size=7, + tick_label_size=7, + shared_fontdict={'family' : 'Helvetica', 'color' : '.1'}, + scale='linear', + writer=None, + fig=None, + bar_kwargs={'alpha': .7}, + filter_column_colors=False) +``` + +### Save animation to disk or return HTML + +Leave the `filename` parameter as `None` to return the animation as HTML. If you are running a Jupyter Notebook, it will automatically be embedded into it. + +```python +bcr.bar_chart_race(df=df, filename=None) +``` + + + +### Customization + +There are many options to customize the bar chart race to get the animation you desire. Below, we have an animation where the maximum x-value and order of the bars are set for the entire duration. A custom summary label and perpendicular bar of median is also added. + +```python +def period_summary(values, ranks): + top2 = values.nlargest(2) + leader = top2.index[0] + lead = top2.iloc[0] - top2.iloc[1] + s = f'{leader} by {lead:.0f}' + return {'s': s, 'x': .95, 'y': .07, 'ha': 'right', 'size': 8} + +bcr.bar_chart_race(df_baseball, period_length=1000, + fixed_max=True, fixed_order=True, n_bars=10, + figsize=(5, 3), period_fmt='Season {x:,.0f}', + title='Top 10 Home Run Hitters by Season Played') +``` + + + + + +%package help +Summary: Development documents and examples for bar-chart-race +Provides: python3-bar-chart-race-doc +%description help +# Bar Chart Race + +[](https://pypi.org/project/bar_chart_race) +[](LICENSE) + +Make animated bar chart races in Python with matplotlib. + + + +## Official Documentation + +Visit the [bar_chart_race official documentation](https://www.dexplo.org/bar_chart_race) for detailed usage instructions. + +## Installation + +Install with either: + +* `pip install bar_chart_race` +* `conda install -c conda-forge bar_chart_race` + +## Quickstart + +Must begin with a pandas DataFrame containing 'wide' data where: + +* Every row represents a single period of time +* Each column holds the value for a particular category +* The index contains the time component (optional) + +The data below is an example of properly formatted data. It shows total deaths from COVID-19 for several countries by date. + + + +### Main function - `bar_chart_race` + +There is one main function, **`bar_chart_race`**, which we use to recreate the above video. All parameters are shown with their default value except for `filename` and `title`. + +```python +import bar_chart_race as bcr +df = bcr.load_dataset('covid19_tutorial') +bcr.bar_chart_race( + df=df, + filename='covid19_horiz.mp4', + orientation='h', + sort='desc', + n_bars=6, + fixed_order=False, + fixed_max=True, + steps_per_period=10, + interpolate_period=False, + label_bars=True, + bar_size=.95, + period_label={'x': .99, 'y': .25, 'ha': 'right', 'va': 'center'}, + period_fmt='%B %d, %Y', + period_summary_func=lambda v, r: {'x': .99, 'y': .18, + 's': f'Total deaths: {v.nlargest(6).sum():,.0f}', + 'ha': 'right', 'size': 8, 'family': 'Courier New'}, + perpendicular_bar_func='median', + period_length=500, + figsize=(5, 3), + dpi=144, + cmap='dark12', + title='COVID-19 Deaths by Country', + title_size='', + bar_label_size=7, + tick_label_size=7, + shared_fontdict={'family' : 'Helvetica', 'color' : '.1'}, + scale='linear', + writer=None, + fig=None, + bar_kwargs={'alpha': .7}, + filter_column_colors=False) +``` + +### Save animation to disk or return HTML + +Leave the `filename` parameter as `None` to return the animation as HTML. If you are running a Jupyter Notebook, it will automatically be embedded into it. + +```python +bcr.bar_chart_race(df=df, filename=None) +``` + + + +### Customization + +There are many options to customize the bar chart race to get the animation you desire. Below, we have an animation where the maximum x-value and order of the bars are set for the entire duration. A custom summary label and perpendicular bar of median is also added. + +```python +def period_summary(values, ranks): + top2 = values.nlargest(2) + leader = top2.index[0] + lead = top2.iloc[0] - top2.iloc[1] + s = f'{leader} by {lead:.0f}' + return {'s': s, 'x': .95, 'y': .07, 'ha': 'right', 'size': 8} + +bcr.bar_chart_race(df_baseball, period_length=1000, + fixed_max=True, fixed_order=True, n_bars=10, + figsize=(5, 3), period_fmt='Season {x:,.0f}', + title='Top 10 Home Run Hitters by Season Played') +``` + + + + + +%prep +%autosetup -n bar-chart-race-0.1.0 + +%build +%py3_build + +%install +%py3_install +install -d -m755 %{buildroot}/%{_pkgdocdir} +if [ -d doc ]; then cp -arf doc %{buildroot}/%{_pkgdocdir}; fi +if [ -d docs ]; then cp -arf docs %{buildroot}/%{_pkgdocdir}; fi +if [ -d example ]; then cp -arf example %{buildroot}/%{_pkgdocdir}; fi +if [ -d examples ]; then cp -arf examples %{buildroot}/%{_pkgdocdir}; fi +pushd %{buildroot} +if [ -d usr/lib ]; then + find usr/lib -type f -printf "/%h/%f\n" >> filelist.lst +fi +if [ -d usr/lib64 ]; then + find usr/lib64 -type f -printf "/%h/%f\n" >> filelist.lst +fi +if [ -d usr/bin ]; then + find usr/bin -type f -printf "/%h/%f\n" >> filelist.lst +fi +if [ -d usr/sbin ]; then + find usr/sbin -type f -printf "/%h/%f\n" >> filelist.lst +fi +touch doclist.lst +if [ -d usr/share/man ]; then + find usr/share/man -type f -printf "/%h/%f.gz\n" >> doclist.lst +fi +popd +mv %{buildroot}/filelist.lst . +mv %{buildroot}/doclist.lst . + +%files -n python3-bar-chart-race -f filelist.lst +%dir %{python3_sitelib}/* + +%files help -f doclist.lst +%{_docdir}/* + +%changelog +* Fri May 05 2023 Python_Bot <Python_Bot@openeuler.org> - 0.1.0-1 +- Package Spec generated |