1
2
3
4
5
6
7
8
9
10
11
12
13
14
15
16
17
18
19
20
21
22
23
24
25
26
27
28
29
30
31
32
33
34
35
36
37
38
39
40
41
42
43
44
45
46
47
48
49
50
51
52
53
54
55
56
57
58
59
60
61
62
63
64
65
66
67
68
69
70
71
72
73
74
75
76
77
78
79
80
81
82
83
84
85
86
87
88
89
90
91
92
93
94
95
96
97
98
99
100
101
102
103
104
105
106
107
108
109
110
111
112
113
114
115
116
117
118
119
120
121
122
123
124
125
126
127
128
129
130
131
132
133
134
135
136
137
138
139
140
141
142
143
144
145
146
147
148
149
150
151
152
153
154
155
156
157
158
159
160
161
162
163
164
165
166
167
168
169
170
171
172
173
174
175
176
177
178
179
180
181
182
183
184
185
186
187
188
189
190
191
192
193
194
195
196
197
198
199
200
201
202
203
204
205
206
207
208
209
210
211
212
213
214
215
216
217
218
219
220
221
222
223
224
225
226
227
228
229
230
231
232
233
234
235
236
237
238
239
240
241
242
243
244
245
246
247
248
249
250
251
252
253
254
255
256
257
258
259
260
261
262
263
264
265
266
267
268
269
270
271
272
273
274
275
276
277
278
279
280
281
282
283
284
285
286
287
288
289
290
291
292
293
294
295
296
297
298
299
300
301
302
303
304
305
306
307
308
309
310
311
312
313
314
315
316
317
318
319
320
321
322
323
324
325
326
327
328
329
330
331
332
333
334
335
336
337
338
339
340
341
342
343
344
345
346
347
348
349
350
351
352
353
354
355
356
357
358
359
360
361
362
363
364
365
366
367
368
369
370
371
372
373
374
375
376
377
378
379
380
381
382
383
384
385
386
387
388
389
390
391
392
393
394
395
396
397
398
399
400
401
402
403
404
405
406
407
408
409
410
411
412
413
414
415
416
417
418
419
420
421
422
423
424
425
426
427
428
429
430
431
432
433
434
435
436
437
438
439
440
441
442
443
444
445
446
447
448
449
450
451
452
453
454
455
456
457
458
459
460
461
462
463
464
465
466
467
468
469
470
471
472
473
474
475
476
477
478
479
480
481
482
483
484
485
486
487
488
489
490
491
492
493
494
495
496
497
498
499
500
501
502
503
504
505
506
507
508
509
510
511
512
513
514
515
516
517
518
519
520
521
522
523
524
525
526
527
528
529
530
531
532
533
534
535
536
537
538
539
540
541
542
543
544
545
546
547
548
549
550
551
552
553
554
555
556
557
558
559
560
561
562
563
564
565
566
567
568
569
570
571
572
573
574
575
576
577
578
579
580
581
582
583
584
585
586
587
588
589
590
591
592
593
594
595
596
597
598
599
600
601
602
603
604
605
606
607
608
609
610
611
612
613
614
615
616
617
618
619
620
621
622
623
624
625
626
627
628
629
630
631
632
633
634
635
636
637
638
639
640
641
642
643
644
645
646
647
648
649
650
651
652
653
654
655
656
657
658
659
660
661
662
663
664
665
666
667
668
669
670
671
672
673
674
675
676
677
678
679
680
681
682
683
684
685
686
687
688
689
690
691
692
693
694
695
696
697
698
699
700
701
702
703
704
705
706
707
708
709
710
711
712
713
714
715
716
717
718
719
720
721
722
723
724
725
726
727
728
729
730
731
732
733
734
735
736
737
738
739
740
741
742
743
744
745
746
747
748
749
750
751
752
753
754
755
756
757
758
759
760
761
762
763
764
765
766
767
768
769
770
771
772
773
774
775
776
777
778
779
780
781
782
783
784
785
786
787
788
789
790
791
792
793
794
795
796
797
798
799
800
801
802
803
804
805
806
807
808
809
810
811
812
813
814
815
816
817
818
819
820
821
822
823
824
825
826
827
828
829
830
831
832
833
834
835
836
837
838
839
840
841
842
843
844
845
846
847
848
849
850
851
852
853
854
855
856
857
858
859
860
861
862
863
864
865
866
867
868
869
870
871
872
873
874
875
876
877
878
879
880
881
882
883
884
885
886
887
888
889
890
891
892
893
894
895
896
897
898
899
900
901
902
903
904
905
906
907
908
909
910
911
912
913
914
915
916
917
918
919
920
921
922
923
924
925
926
927
928
929
|
%global _empty_manifest_terminate_build 0
Name: python-filewave-extra-metrics
Version: 1.0.46
Release: 1
Summary: An additional module that exposes s/ware patching and metrics information to the built in FileWave dashboard
License: MIT License
URL: https://github.com/johncclayton/useful_dashboard_info
Source0: https://mirrors.aliyun.com/pypi/web/packages/be/9a/cd0a11b789a1b95950f60950292b23f25e2a98a19ffc64e447d02bfe64a8/filewave-extra-metrics-1.0.46.tar.gz
BuildArch: noarch
Requires: python3-requests
Requires: python3-prometheus-client
Requires: python3-pandas
Requires: python3-PyYAML
Requires: python3-click
Requires: python3-progressbar2
Requires: python3-pyzmq
Requires: python3-asyncio-periodic
%description
# FileWave Extra Metrics
The purpose of the Extra Metrics project is to augment a standard v14 FileWave installation with additional metrics and dashboard capabilities.
# Overview
Extra Metrics provides a series of dashboards and prometheus metrics related to how your fleets deployments are progressing. The information can be used to show "at-a-glance" insights into the software patch status, device health and user specific deployments.
In as many cases as possible the Dashboard panels are linked into the FileWave Web, making it easy to "drill down" into more detail and take action.
# What dashboards are created by Extra Metrics?
## Software Patch Status
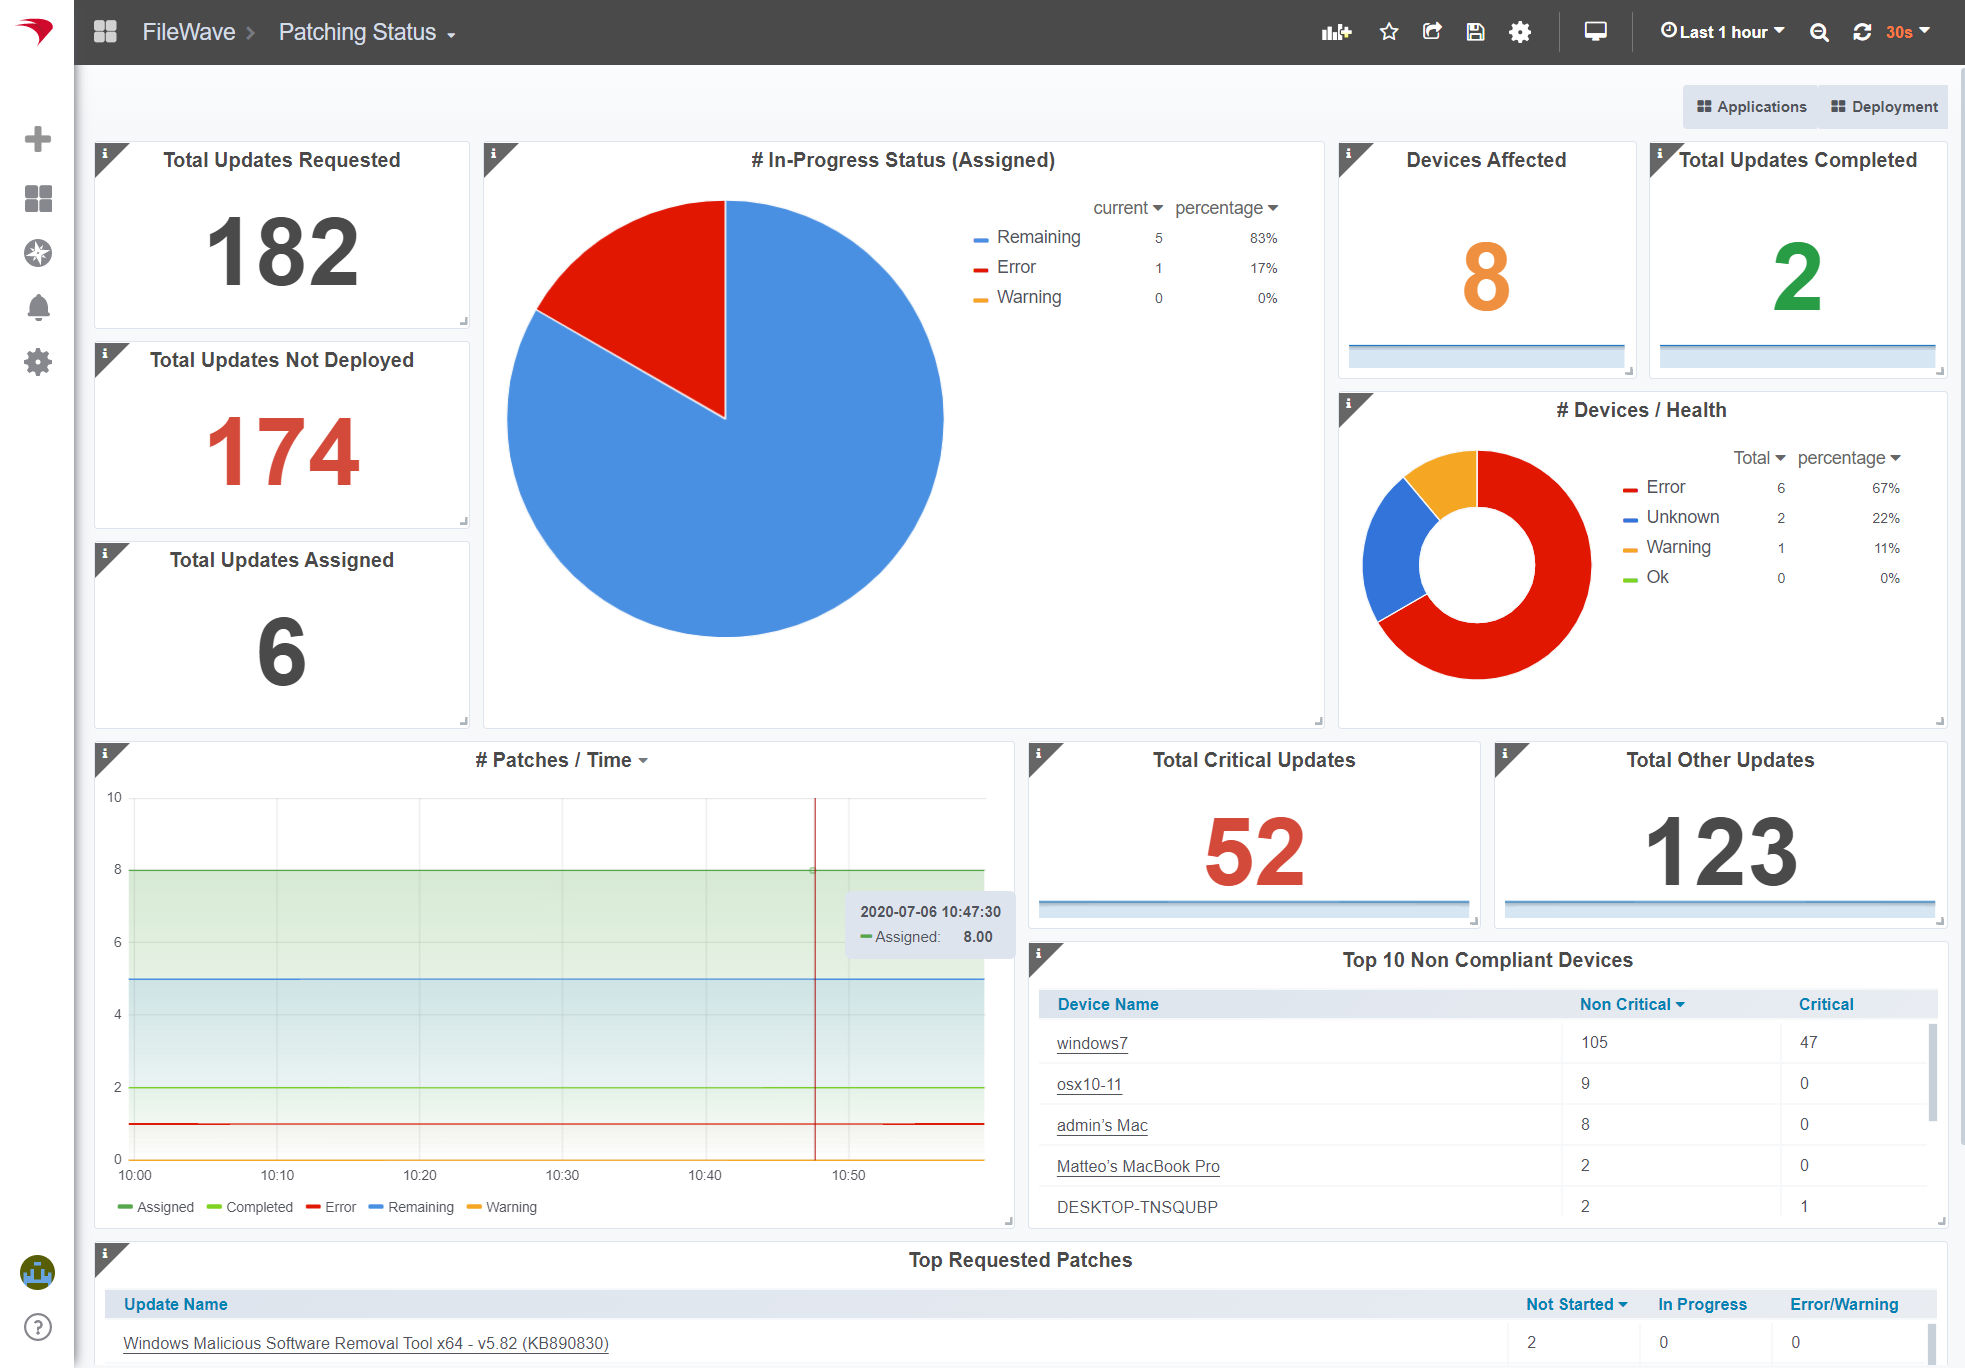
What patches are available to be deployed? What is already being taken care of? How many devices are effected?
The software update (patch status) of clients is calculated using software update catalogs as well as information delivered by clients about the updates they require.
## Applications
What apps are up to date? Are many people making use of older, perhaps insecure apps?
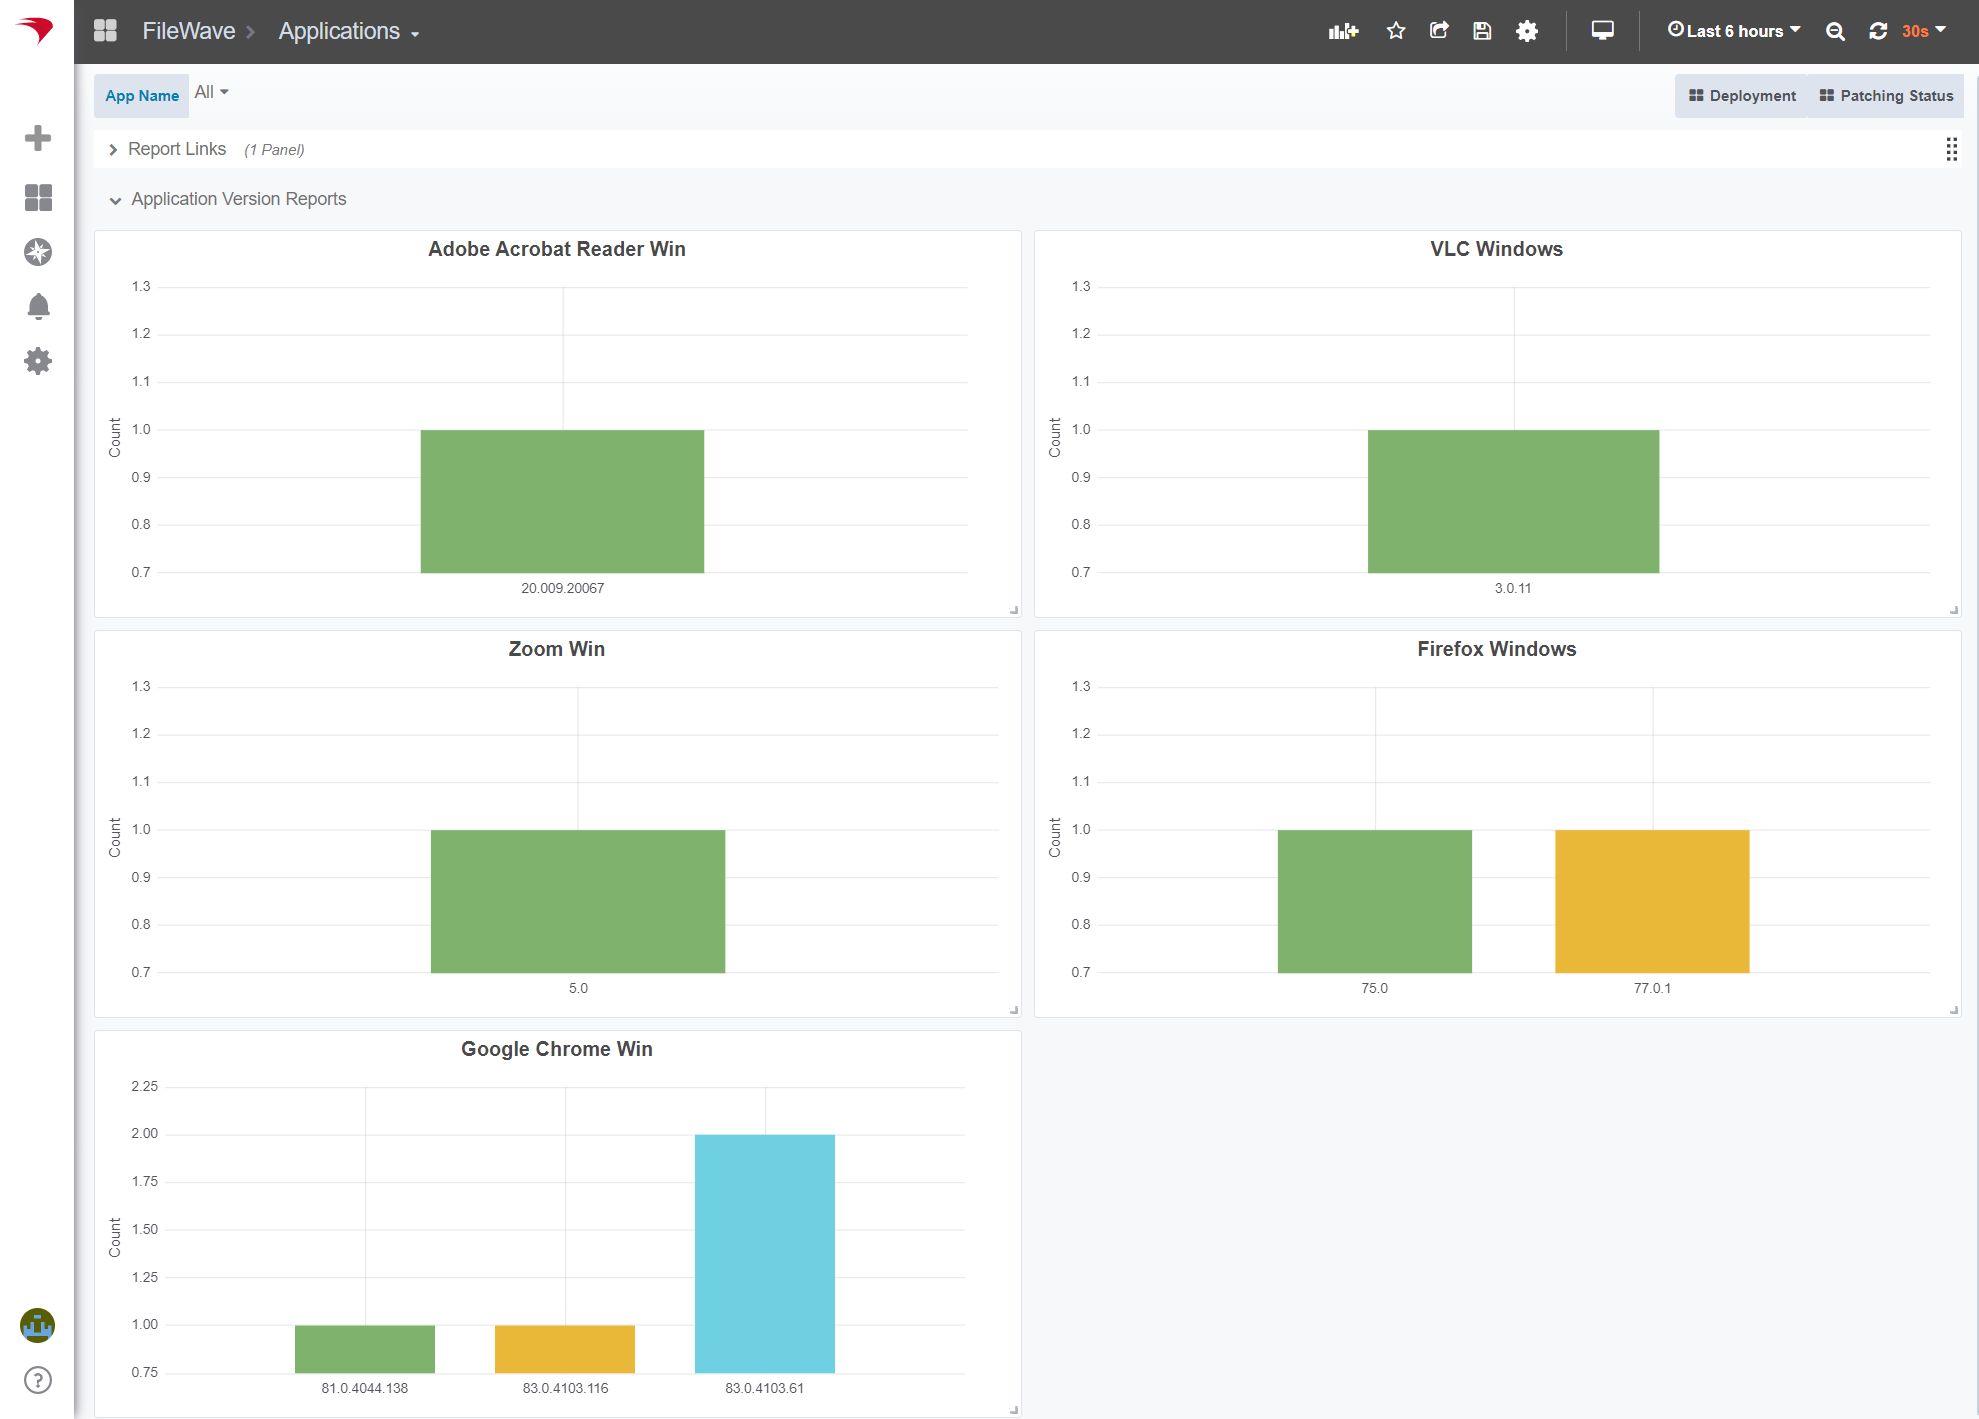
The Extra Metrics program provides sample queries for some popular apps, they are stored as inventory queries in FileWave.
### Make your own app queries
Extra Metrics drives its dashboard from queries in FileWave.
Simply add new application queries into the 'Extra Metrics Queries - Apps' group and the Extra Metrics program will check them for required columns (app name + version) and include them automatically in this dashboard!
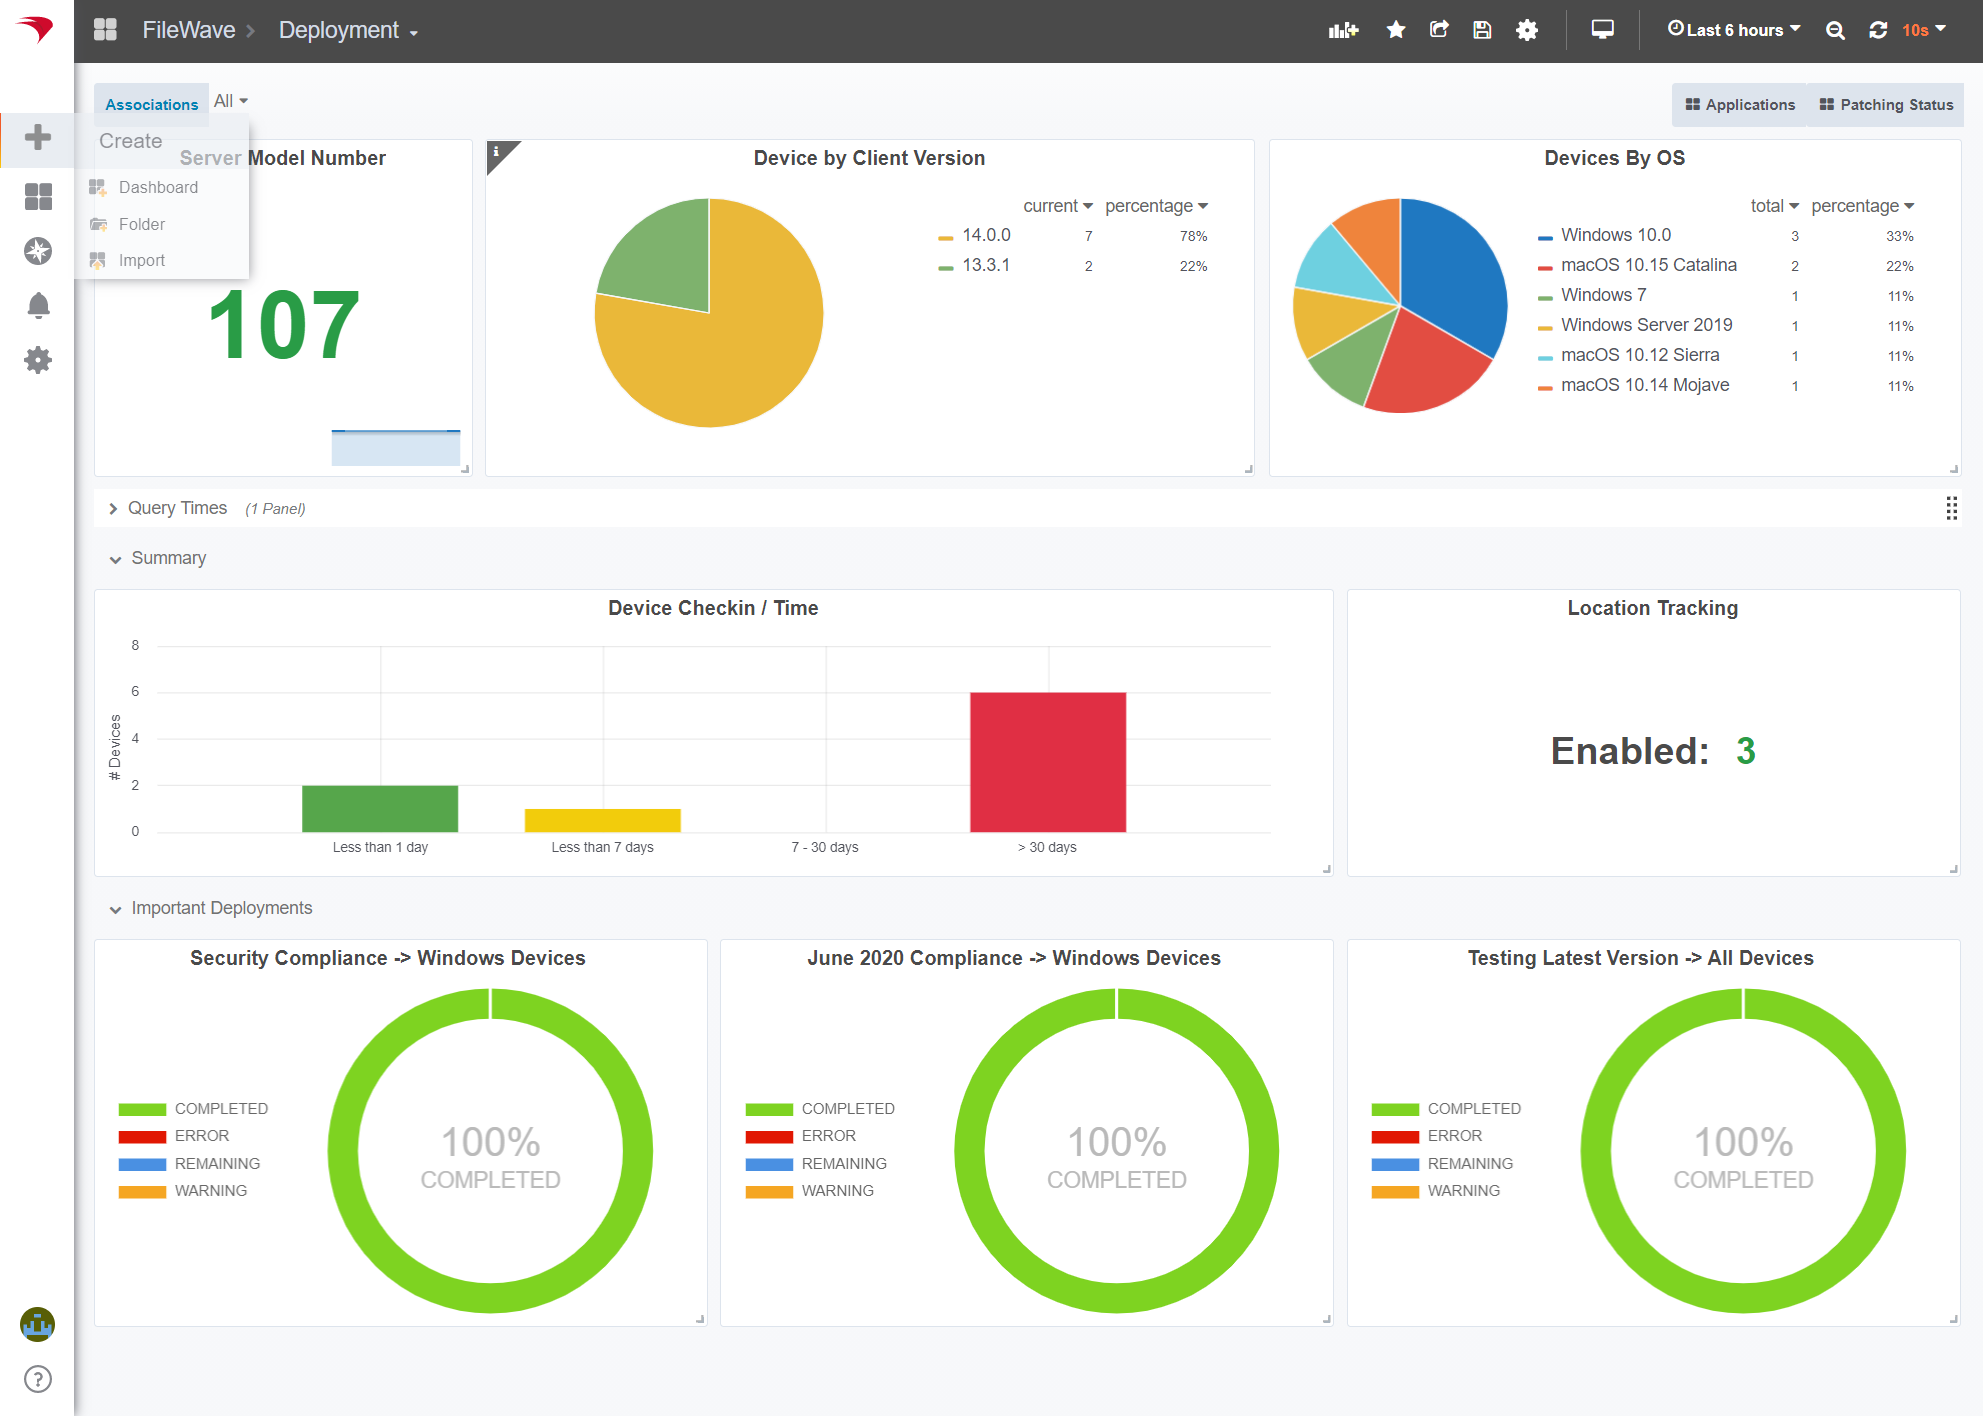
## Deployment
Which clients are not checking in quickly enough? Are all my clients using the latest version of the FileWave Client software? How many devices are being tracked or marked as missing? Am I exposed to security problems due to old OS versions?
The Deployment dashboard provides sample panels showing the devices grouped by client version, as well as a bar graph showing how frequently devices are checking in.
# Requirements / Check List
Minimum FileWave system requirements for success are as follows:
1. FileWave Version 14+ - it will not work with v13
1. FileWave Version 14+ must be running on a Linux Server
2. SSH Access to the FileWave Server
3. A base64 API Key specifically for Extra Metrics (with inventory and query *create* rights). You will require the base64 text, this can be obtained from the Manage Administrators -> Application tokens screen.
4. Make sure your server has SSL certificates - self signed certs are *not* enough.
5. You must have an externally reachable DNS name.
# Review before beginning installation
These instructions will have you install Extra Metrics directly on your FileWave Server within a python virtual environment.
Important:
> We *only* recommend installing Extra Metrics into its own python virtual environment. Doing so ensures that the introduction of this module cannot interfere with the operational integrity of your FileWave Server.
> DO NOT INSTALL EXTRA METRICS DIRECTLY INTO THE PYTHON RUNTIME ENVIRONMENT OF YOUR FILEWAVE SERVER.
> If you are unsure about the above statement - STOP - contact your FileWave SE or support. Your FileWave Server installation can be destroyed by mis-understanding the impact of this configuration.
Mac:
> On a Mac, you must install a version of Python that allows non-codesigned binaries to be installed into the Python environment. _On a Mac server: It is not possible to use the FileWave provided version of Python to run Extra Metrics_
## First Time Installation
Log into your FileWave Server using SSH, follow along to set up the virtual environment, install the Extra Metrics package and configure it. For the purpose of these instructions we are assuming a non-root user is being used.
Create a virtual environment for Extra Metrics:
$ /usr/local/filewave/python/bin/pyvenv $HOME/extra-metrics
$ source $HOME/extra-metrics/bin/activate
Now install the FileWave Extra Metrics package into the virtual environment:
(extra-metrics) $ pip install filewave-extra-metrics
Extra Metrics is now downloaded but not configured; before completing configuration you need an API Key (and SSL certs)
## Create & configure an Inventory API Key
Extra Metrics should be configured with an Inventory API Key in order to access Inventory and create the inventory groups and queries. You will need the base64 text version of this API Key, which can be obtained from the Manage Administrators -> Application tokens dialog in the FileWave Administrator console.
> Please create a unique access token (API Key) for the Extra Metrics module
## Configure Extra Metrics
The configuration step takes care of the following automatically:
- installation of a supervisord job to run the module
- installation of prometheus scrape configuration that targets the extra-metrics job
- installation & provisioning of 3 example dashboards into grafana
- upgrading grafana pie chart to the latest version
- storing the API key and DNS name
- dynamically injecting the external DNS name into the dashboards so that links to the FileWave web UI work correctly
> Note: the _extra-metrics-config_ command is part of the filewave-extra-metrics package; you will need the full path to this command if you are using sudo because sudo typically drops the existing PATH statement as a security measure.
> The key to running the extra-metrics-config command is that it must be run with root privs. If you are already logged in as root you can simply do the following:
$ extra-metrics-config -a my_base64_API_key_value -e my_filewave_server_dns_name
Use the following commands to configure the server properly (you need to re-run this if the DNS name or API key changes):
$ export CONFIG_PATH=`which extra-metrics-config`
$ export API_KEY='insert-your-api-key-here'
$ export DNS_NAME='dns-name-of-fw-server-here'
$ sudo $CONFIG_PATH --api-key $API_KEY --external-dns-name $DNS_NAME
[extra-metrics] [INFO] loading the configuration from file /usr/local/etc/filewave/extra_metrics.ini
[extra-metrics] [INFO] saved configuration to file: /usr/local/etc/filewave/extra_metrics.ini
[extra-metrics] [INFO] wrote dashboard file: /usr/local/etc/filewave/grafana/provisioning/dashboards/extra-metrics-Applications.json
[extra-metrics] [INFO] wrote dashboard file: /usr/local/etc/filewave/grafana/provisioning/dashboards/extra-metrics-Deployment.json
[extra-metrics] [INFO] wrote dashboard file: /usr/local/etc/filewave/grafana/provisioning/dashboards/extra-metrics-PatchStatus.json
[extra-metrics] [INFO]
[extra-metrics] [INFO] Configuration Summary
[extra-metrics] [INFO] =====================
[extra-metrics] [INFO] API Key: eZBlNWFlNTYwLTqZZWEtNDMwYS1iNTa0LTlmZTkxODFjOdaxNH6=
[extra-metrics] [INFO] External DNS: srv.cluster.tech
[extra-metrics] [INFO] detected FileWave instance running version: 14.0.0
## Restarting Services
If this is the first time you have installed the Extra Metrics module; you will need to tell supervisord to reload its configuration and to start the extra-metrics job.
$ /usr/local/filewave/python/bin/supervisorctl update
And you should restart Grafana so it can import the new dashboards.
$ fwcontrol dashboard restart
## Validating
> Note: it can take a few seconds (60 or so) for the metrics to be collected by prometheus and made available.
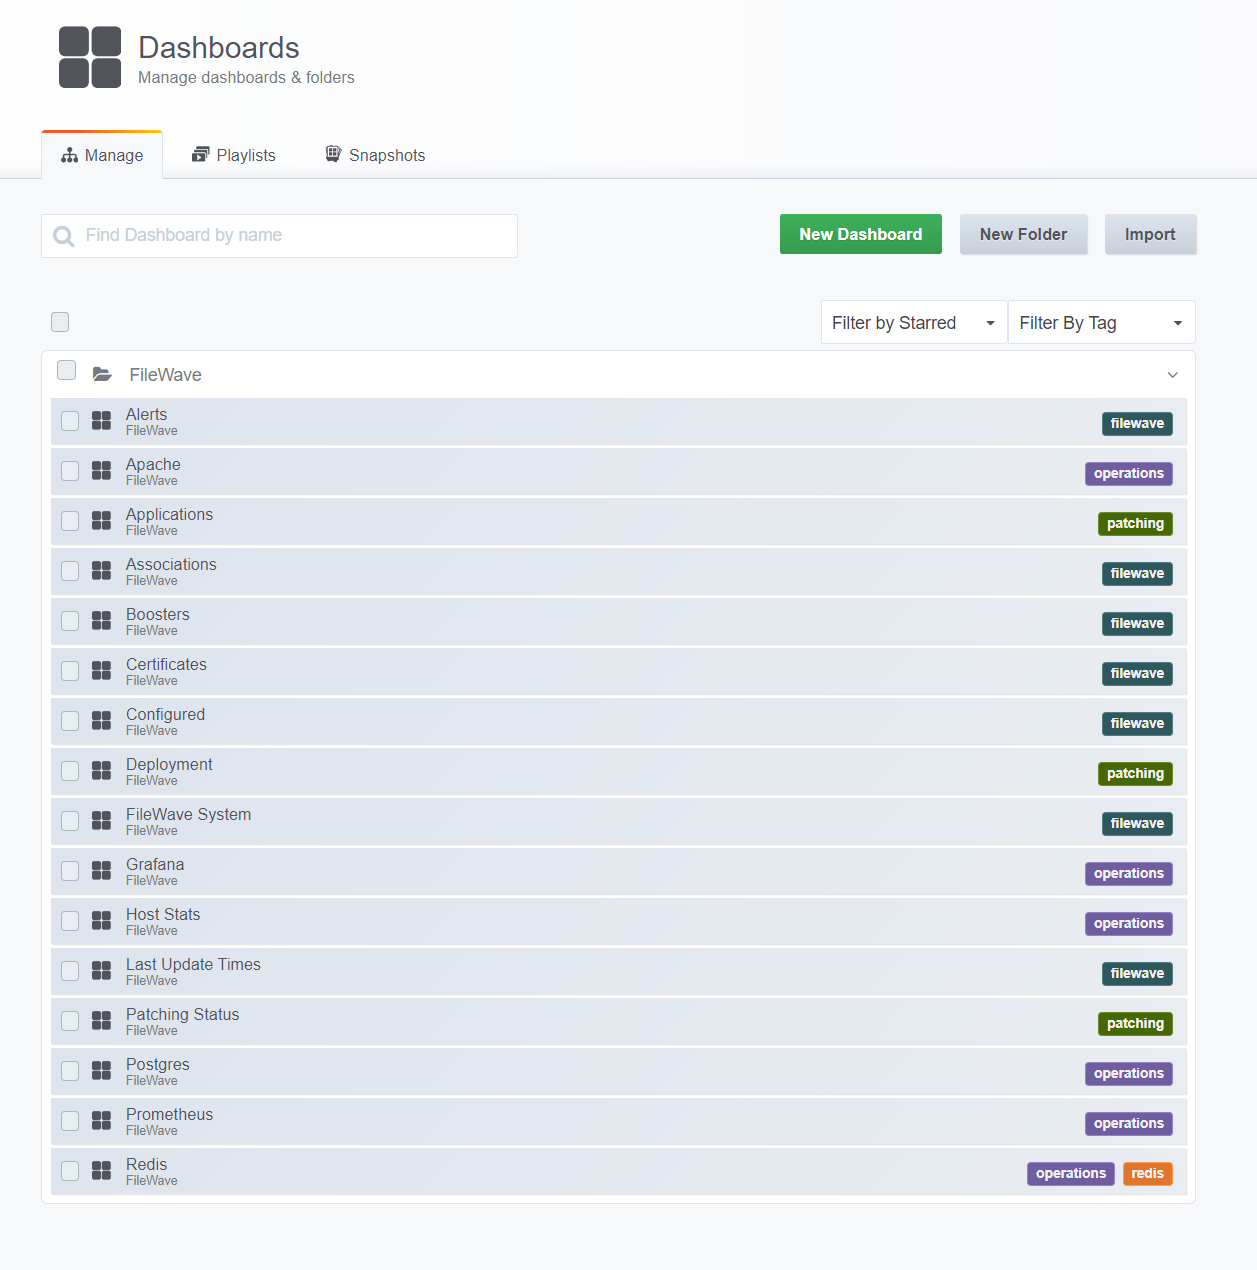
When you view the list of dashboards available in Grafana, you'll see 3 new ones - each with a 'patching' tag, as shown below:
## Upgrading Extra Metrics
To upgrade the Extra Metrics module; just run the install command again but include an '--upgrade' flag. It is recommended to run the "config" portion of the setup again to make sure that any configuration & dashboard panel changes have been applied as well and then restart services.
$ pip install --upgrade filewave-extra-metrics
$ sudo $CONFIG_PATH
$ /usr/local/filewave/python/bin/supervisorctl update
$ /usr/local/filewave/python/bin/supervisorctl restart extra_metrics
### Upgrading to a Release Candidate
To install a release candidate, run the install command again but include the '--pre' flag.
$ pip install --upgrade --pre filewave-extra-metrics
$ sudo $CONFIG_PATH
$ /usr/local/filewave/python/bin/supervisorctl update
$ /usr/local/filewave/python/bin/supervisorctl restart extra_metrics
# Misc.
## Hint: don't skip this - SSL Certs
Make sure you have an SSL certificate, it must be valid, trusted by everyone (not just the server) and absolutely under no circumstances should it be self signed.
Do this - you'll save yourself untold pain. Trust me I'm still healing.
## How can I be notified of updates?
Subscribe to this RSS feed: https://pypi.org/rss/project/filewave-extra-metrics/releases.xml
## Device Health - how is it calculated?
The whole fleet of devices is continuously sending data back to the FileWave Inventory system which is used to calculate device health.
The health of a device is calculated using three components:
1. Check-in days: the number of days since the device last checked into filewave
2. Disk free space: the proportion of free disk space left on the device
3. Patching; the number & type of patches still outstanding (based on what the client device has requested)
NOTE: The dashboard exposes a single state; but in reality the device has patch, check-in and disk state. *_The dashboard is simply exposing the WORST state overall._*
### Device Health Details
Checkin-days: If check-in days isn't known, the state is UNKNOWN. If it's < 7 the state is OK, < 14 the state is WARNING otherwise the state is ERROR
Disk space: If the disk space details are unknown the state is UNKNOWN, otherwise percentage disk space left is calculated (%left). If %left > 20% the state is OK, if %left is < 5% the state is ERROR otherwise the state is WARNING.
Patching: If there are any critical patches outstanding (unassigned, remaining or in an error / warning state), the state is ERROR. If there are any normal patches outstanding the state is WARNING. If there are no patches outstanding the device state is OK.
# What metrics are being exposed to prometheus?
## Metrics
extra_metrics_http_request_time_taken - REST queries made by extra metrics are timed; the response time is stored in a series of buckets within this metric.
extra_metrics_application_version - a summary of how many devices are using a particular app & version
extra_metrics_software_updates_by_state - buckets of all the software updates by state - the value is the number of devices in each state, this includes completed updates. The states are:
- Requested: total number of software updates requested (think of this as devices * updates)
- Unassigned: total number of software updates not assigned to a device (devices * updates)
- Assigned: the total number of updates associated / assigned to a device
- Remaining: the total number of updates that are in-progress that have yet to be completed
- Completed: the total number of completed updates
- Error / Warning: the total number of errors / warnings
extra_metrics_software_updates_by_critical - lists all the updates, indicating the number of normal vs critical updates currently known by the server.
extra_metrics_software_updates_by_popularity - list of software updates and the number of devices still needing the update (unassigned), completed updates are not included in this count.
extra_metrics_software_updates_by_age - list of software updates and their age in days, all updates including completed ones are included here. The value of the metric is the age in days (from now).
extra_metrics_software_updates_remaining_by_device - list of devices and the number of [critical] updates they have remaining to be installed, completed updates are not included in this count.
extra_metrics_devices_by_checkin_days - interesting stats on a per device basis, days since checked, compliance status.
extra_metrics_per_device_modelnum - provides a value of the model number per device.
extra_metrics_per_device_compliance - provides a value of the compliance state per device
extra_metrics_per_device_client_version - number of devices rolled up by client version
extra_metrics_per_device_platform - number of devices rolled up by platform
extra_metrics_per_device_tracked - number of devices being tracked
extra_metrics_per_device_locked - number of devices locked
### Reference
Adjust supervisorctl to include --storage.tsdb.allow-overlapping-blocks?
# Developers
To upload to PyPi, ensure you have the credentials in a pypi.config file (not checked into source control). To rebuild the package use ./rebuild_for_pypi.sh, to upload the package to PyPi use ./upload_to_pypi.sh.
An example pypi.config file contains:
```
[pypi]
username = __token__
password = pypi-AgEIcH.....<add your really long token here>
```
## Versioning
It can be very convenient to publish a release candidate to PyPi in order to make testing of the install scripts easier.
The versioning is controlled by the setup.py file.
```python
setuptools.setup(
name="filewave-extra-metrics",
version="1.0.36rc6"
```
Some things to rememeber:
1. if this is the first time you are pushing an RC - always increment the major revision first. For example, if the current revision is 1.0.35, then you should change the version for the RC to 1.0.36rc1
2. to upgrade installations with the currently published RC, use the following command:
$ pip install --upgrade --pre filewave-extra-metrics
# Changelog
07-Aug-2020 (v45)
- made the check-in days panel use log2 for the y-axis, smoothing out peaks in data
06-Aug-2020 (v44)
- adjusted health status such that devices that have not checked in are considered "Ok" instead of "Error"
- fixed the client query to return all device types; not just desktop devices - which makes device counts accurate across all the client metrics.
- fixed an issue that could result in duplicate queries being injected into the 'Extra Metrics Queries - Apps' reports group.
- added the ability to override logging (default level is now WARNING not INFO), use the env value EXTRA_METRICS_LOGLEVEL and specify DEBUG, INFO, ERROR or WARNING as appropriate.
- fixed up the device health mapping that caused some devices to appear as "Unknown".
- adjusted the health panel to be an instant query.
- adjusted the in-progress software patches panel to show everything except requested, assigned device data - resulting in a more natural view of the progress.
- adjusted the #patches / time panel to match the data in the in-progress software patches panel so they show data consistent with each other.
28-Jul-2020 (v43)
- fixed: datetime parse error in software updates due to differently formatted date data for mobile/desktops
01-Jul-2020 (v36)
- fixed: look for zmq_subscribe_curve.keypair in /usr/local/filewave/certs, events are now received for both compat and secure modes of FileWave Server.
- fixed: software update status is now driven entirely from a new web ui based endpoint which makes it possible to deliver a visualization of patch progress
- fixed: the 'health' metrics per device now make use of feedback from software update - so the number of critical vs normal patches outstanding impacts the health calculation
- fixed: bad/missing data caused a crash in some of the compliance calculations.
- new: additional log messages on startup to help describe why an abort might happen (bad api keys, no data returned from health checks)
- new: added unit tests for the software update aggregations via the web rest API
- changed: redefined the software update metrics to distinguish between completed patches, and everything else
23-Jun-2020 (v35)
- new (and experimental): works on Mac; but *requires* a brew installed Python instance; the built-in FileWave python 3.7 binaries will not work as they don't allow non codesigned PyPi packages to be installed. FileWave Extra Metrics uses numpy, which is unsigned.
- new option (--dont-verify-tls) for extra-metrics-config; turns off TLS verification - the change is stored in configuration
19-Jun-2020 (v32):
- new: configuration for the polling delay, default is 30m (but re-queries happen automatically on model update and query changes)
- new: work on making it possible to run this on a Mac server (experimental at this point)
- cleaned up links on the Patch Status dashboard and fixed the tags/links to other dashboards
- wrote unit tests to make sure that the dashboard JSON is correct before deploying it
- corrected install/pip requirements that were missing
17-Jun-2020 (v29):
- experimental: re-runs app queries if any new query is updated, model update is run - this paves the way for reducing the number of polling requests being made, once more events are being sent from the FW server
- the app version dashboard now properly reflects the queries in the group 'Extra Metrics Queries - Apps', there is now one panel for each query.
- the app version dashboard now contains a quicklinks panel; allowing users to quickly get into the web UI for each of their app queries
- the server version check is now performed via a REST call instead of using local binaries and parsing that result
- changed to asyncio under the hood to allow for subscriptions to FW server events and removed dependancy on TimeLoop module
%package -n python3-filewave-extra-metrics
Summary: An additional module that exposes s/ware patching and metrics information to the built in FileWave dashboard
Provides: python-filewave-extra-metrics
BuildRequires: python3-devel
BuildRequires: python3-setuptools
BuildRequires: python3-pip
%description -n python3-filewave-extra-metrics
# FileWave Extra Metrics
The purpose of the Extra Metrics project is to augment a standard v14 FileWave installation with additional metrics and dashboard capabilities.
# Overview
Extra Metrics provides a series of dashboards and prometheus metrics related to how your fleets deployments are progressing. The information can be used to show "at-a-glance" insights into the software patch status, device health and user specific deployments.
In as many cases as possible the Dashboard panels are linked into the FileWave Web, making it easy to "drill down" into more detail and take action.
# What dashboards are created by Extra Metrics?
## Software Patch Status
What patches are available to be deployed? What is already being taken care of? How many devices are effected?
The software update (patch status) of clients is calculated using software update catalogs as well as information delivered by clients about the updates they require.

## Applications
What apps are up to date? Are many people making use of older, perhaps insecure apps?

The Extra Metrics program provides sample queries for some popular apps, they are stored as inventory queries in FileWave.
### Make your own app queries
Extra Metrics drives its dashboard from queries in FileWave.
Simply add new application queries into the 'Extra Metrics Queries - Apps' group and the Extra Metrics program will check them for required columns (app name + version) and include them automatically in this dashboard!
## Deployment
Which clients are not checking in quickly enough? Are all my clients using the latest version of the FileWave Client software? How many devices are being tracked or marked as missing? Am I exposed to security problems due to old OS versions?
The Deployment dashboard provides sample panels showing the devices grouped by client version, as well as a bar graph showing how frequently devices are checking in.

# Requirements / Check List
Minimum FileWave system requirements for success are as follows:
1. FileWave Version 14+ - it will not work with v13
1. FileWave Version 14+ must be running on a Linux Server
2. SSH Access to the FileWave Server
3. A base64 API Key specifically for Extra Metrics (with inventory and query *create* rights). You will require the base64 text, this can be obtained from the Manage Administrators -> Application tokens screen.
4. Make sure your server has SSL certificates - self signed certs are *not* enough.
5. You must have an externally reachable DNS name.
# Review before beginning installation
These instructions will have you install Extra Metrics directly on your FileWave Server within a python virtual environment.
Important:
> We *only* recommend installing Extra Metrics into its own python virtual environment. Doing so ensures that the introduction of this module cannot interfere with the operational integrity of your FileWave Server.
> DO NOT INSTALL EXTRA METRICS DIRECTLY INTO THE PYTHON RUNTIME ENVIRONMENT OF YOUR FILEWAVE SERVER.
> If you are unsure about the above statement - STOP - contact your FileWave SE or support. Your FileWave Server installation can be destroyed by mis-understanding the impact of this configuration.
Mac:
> On a Mac, you must install a version of Python that allows non-codesigned binaries to be installed into the Python environment. _On a Mac server: It is not possible to use the FileWave provided version of Python to run Extra Metrics_
## First Time Installation
Log into your FileWave Server using SSH, follow along to set up the virtual environment, install the Extra Metrics package and configure it. For the purpose of these instructions we are assuming a non-root user is being used.
Create a virtual environment for Extra Metrics:
$ /usr/local/filewave/python/bin/pyvenv $HOME/extra-metrics
$ source $HOME/extra-metrics/bin/activate
Now install the FileWave Extra Metrics package into the virtual environment:
(extra-metrics) $ pip install filewave-extra-metrics
Extra Metrics is now downloaded but not configured; before completing configuration you need an API Key (and SSL certs)
## Create & configure an Inventory API Key
Extra Metrics should be configured with an Inventory API Key in order to access Inventory and create the inventory groups and queries. You will need the base64 text version of this API Key, which can be obtained from the Manage Administrators -> Application tokens dialog in the FileWave Administrator console.
> Please create a unique access token (API Key) for the Extra Metrics module
## Configure Extra Metrics
The configuration step takes care of the following automatically:
- installation of a supervisord job to run the module
- installation of prometheus scrape configuration that targets the extra-metrics job
- installation & provisioning of 3 example dashboards into grafana
- upgrading grafana pie chart to the latest version
- storing the API key and DNS name
- dynamically injecting the external DNS name into the dashboards so that links to the FileWave web UI work correctly
> Note: the _extra-metrics-config_ command is part of the filewave-extra-metrics package; you will need the full path to this command if you are using sudo because sudo typically drops the existing PATH statement as a security measure.
> The key to running the extra-metrics-config command is that it must be run with root privs. If you are already logged in as root you can simply do the following:
$ extra-metrics-config -a my_base64_API_key_value -e my_filewave_server_dns_name
Use the following commands to configure the server properly (you need to re-run this if the DNS name or API key changes):
$ export CONFIG_PATH=`which extra-metrics-config`
$ export API_KEY='insert-your-api-key-here'
$ export DNS_NAME='dns-name-of-fw-server-here'
$ sudo $CONFIG_PATH --api-key $API_KEY --external-dns-name $DNS_NAME
[extra-metrics] [INFO] loading the configuration from file /usr/local/etc/filewave/extra_metrics.ini
[extra-metrics] [INFO] saved configuration to file: /usr/local/etc/filewave/extra_metrics.ini
[extra-metrics] [INFO] wrote dashboard file: /usr/local/etc/filewave/grafana/provisioning/dashboards/extra-metrics-Applications.json
[extra-metrics] [INFO] wrote dashboard file: /usr/local/etc/filewave/grafana/provisioning/dashboards/extra-metrics-Deployment.json
[extra-metrics] [INFO] wrote dashboard file: /usr/local/etc/filewave/grafana/provisioning/dashboards/extra-metrics-PatchStatus.json
[extra-metrics] [INFO]
[extra-metrics] [INFO] Configuration Summary
[extra-metrics] [INFO] =====================
[extra-metrics] [INFO] API Key: eZBlNWFlNTYwLTqZZWEtNDMwYS1iNTa0LTlmZTkxODFjOdaxNH6=
[extra-metrics] [INFO] External DNS: srv.cluster.tech
[extra-metrics] [INFO] detected FileWave instance running version: 14.0.0
## Restarting Services
If this is the first time you have installed the Extra Metrics module; you will need to tell supervisord to reload its configuration and to start the extra-metrics job.
$ /usr/local/filewave/python/bin/supervisorctl update
And you should restart Grafana so it can import the new dashboards.
$ fwcontrol dashboard restart
## Validating
> Note: it can take a few seconds (60 or so) for the metrics to be collected by prometheus and made available.
When you view the list of dashboards available in Grafana, you'll see 3 new ones - each with a 'patching' tag, as shown below:

## Upgrading Extra Metrics
To upgrade the Extra Metrics module; just run the install command again but include an '--upgrade' flag. It is recommended to run the "config" portion of the setup again to make sure that any configuration & dashboard panel changes have been applied as well and then restart services.
$ pip install --upgrade filewave-extra-metrics
$ sudo $CONFIG_PATH
$ /usr/local/filewave/python/bin/supervisorctl update
$ /usr/local/filewave/python/bin/supervisorctl restart extra_metrics
### Upgrading to a Release Candidate
To install a release candidate, run the install command again but include the '--pre' flag.
$ pip install --upgrade --pre filewave-extra-metrics
$ sudo $CONFIG_PATH
$ /usr/local/filewave/python/bin/supervisorctl update
$ /usr/local/filewave/python/bin/supervisorctl restart extra_metrics
# Misc.
## Hint: don't skip this - SSL Certs
Make sure you have an SSL certificate, it must be valid, trusted by everyone (not just the server) and absolutely under no circumstances should it be self signed.
Do this - you'll save yourself untold pain. Trust me I'm still healing.
## How can I be notified of updates?
Subscribe to this RSS feed: https://pypi.org/rss/project/filewave-extra-metrics/releases.xml
## Device Health - how is it calculated?
The whole fleet of devices is continuously sending data back to the FileWave Inventory system which is used to calculate device health.
The health of a device is calculated using three components:
1. Check-in days: the number of days since the device last checked into filewave
2. Disk free space: the proportion of free disk space left on the device
3. Patching; the number & type of patches still outstanding (based on what the client device has requested)
NOTE: The dashboard exposes a single state; but in reality the device has patch, check-in and disk state. *_The dashboard is simply exposing the WORST state overall._*
### Device Health Details
Checkin-days: If check-in days isn't known, the state is UNKNOWN. If it's < 7 the state is OK, < 14 the state is WARNING otherwise the state is ERROR
Disk space: If the disk space details are unknown the state is UNKNOWN, otherwise percentage disk space left is calculated (%left). If %left > 20% the state is OK, if %left is < 5% the state is ERROR otherwise the state is WARNING.
Patching: If there are any critical patches outstanding (unassigned, remaining or in an error / warning state), the state is ERROR. If there are any normal patches outstanding the state is WARNING. If there are no patches outstanding the device state is OK.
# What metrics are being exposed to prometheus?
## Metrics
extra_metrics_http_request_time_taken - REST queries made by extra metrics are timed; the response time is stored in a series of buckets within this metric.
extra_metrics_application_version - a summary of how many devices are using a particular app & version
extra_metrics_software_updates_by_state - buckets of all the software updates by state - the value is the number of devices in each state, this includes completed updates. The states are:
- Requested: total number of software updates requested (think of this as devices * updates)
- Unassigned: total number of software updates not assigned to a device (devices * updates)
- Assigned: the total number of updates associated / assigned to a device
- Remaining: the total number of updates that are in-progress that have yet to be completed
- Completed: the total number of completed updates
- Error / Warning: the total number of errors / warnings
extra_metrics_software_updates_by_critical - lists all the updates, indicating the number of normal vs critical updates currently known by the server.
extra_metrics_software_updates_by_popularity - list of software updates and the number of devices still needing the update (unassigned), completed updates are not included in this count.
extra_metrics_software_updates_by_age - list of software updates and their age in days, all updates including completed ones are included here. The value of the metric is the age in days (from now).
extra_metrics_software_updates_remaining_by_device - list of devices and the number of [critical] updates they have remaining to be installed, completed updates are not included in this count.
extra_metrics_devices_by_checkin_days - interesting stats on a per device basis, days since checked, compliance status.
extra_metrics_per_device_modelnum - provides a value of the model number per device.
extra_metrics_per_device_compliance - provides a value of the compliance state per device
extra_metrics_per_device_client_version - number of devices rolled up by client version
extra_metrics_per_device_platform - number of devices rolled up by platform
extra_metrics_per_device_tracked - number of devices being tracked
extra_metrics_per_device_locked - number of devices locked
### Reference
Adjust supervisorctl to include --storage.tsdb.allow-overlapping-blocks?
# Developers
To upload to PyPi, ensure you have the credentials in a pypi.config file (not checked into source control). To rebuild the package use ./rebuild_for_pypi.sh, to upload the package to PyPi use ./upload_to_pypi.sh.
An example pypi.config file contains:
```
[pypi]
username = __token__
password = pypi-AgEIcH.....<add your really long token here>
```
## Versioning
It can be very convenient to publish a release candidate to PyPi in order to make testing of the install scripts easier.
The versioning is controlled by the setup.py file.
```python
setuptools.setup(
name="filewave-extra-metrics",
version="1.0.36rc6"
```
Some things to rememeber:
1. if this is the first time you are pushing an RC - always increment the major revision first. For example, if the current revision is 1.0.35, then you should change the version for the RC to 1.0.36rc1
2. to upgrade installations with the currently published RC, use the following command:
$ pip install --upgrade --pre filewave-extra-metrics
# Changelog
07-Aug-2020 (v45)
- made the check-in days panel use log2 for the y-axis, smoothing out peaks in data
06-Aug-2020 (v44)
- adjusted health status such that devices that have not checked in are considered "Ok" instead of "Error"
- fixed the client query to return all device types; not just desktop devices - which makes device counts accurate across all the client metrics.
- fixed an issue that could result in duplicate queries being injected into the 'Extra Metrics Queries - Apps' reports group.
- added the ability to override logging (default level is now WARNING not INFO), use the env value EXTRA_METRICS_LOGLEVEL and specify DEBUG, INFO, ERROR or WARNING as appropriate.
- fixed up the device health mapping that caused some devices to appear as "Unknown".
- adjusted the health panel to be an instant query.
- adjusted the in-progress software patches panel to show everything except requested, assigned device data - resulting in a more natural view of the progress.
- adjusted the #patches / time panel to match the data in the in-progress software patches panel so they show data consistent with each other.
28-Jul-2020 (v43)
- fixed: datetime parse error in software updates due to differently formatted date data for mobile/desktops
01-Jul-2020 (v36)
- fixed: look for zmq_subscribe_curve.keypair in /usr/local/filewave/certs, events are now received for both compat and secure modes of FileWave Server.
- fixed: software update status is now driven entirely from a new web ui based endpoint which makes it possible to deliver a visualization of patch progress
- fixed: the 'health' metrics per device now make use of feedback from software update - so the number of critical vs normal patches outstanding impacts the health calculation
- fixed: bad/missing data caused a crash in some of the compliance calculations.
- new: additional log messages on startup to help describe why an abort might happen (bad api keys, no data returned from health checks)
- new: added unit tests for the software update aggregations via the web rest API
- changed: redefined the software update metrics to distinguish between completed patches, and everything else
23-Jun-2020 (v35)
- new (and experimental): works on Mac; but *requires* a brew installed Python instance; the built-in FileWave python 3.7 binaries will not work as they don't allow non codesigned PyPi packages to be installed. FileWave Extra Metrics uses numpy, which is unsigned.
- new option (--dont-verify-tls) for extra-metrics-config; turns off TLS verification - the change is stored in configuration
19-Jun-2020 (v32):
- new: configuration for the polling delay, default is 30m (but re-queries happen automatically on model update and query changes)
- new: work on making it possible to run this on a Mac server (experimental at this point)
- cleaned up links on the Patch Status dashboard and fixed the tags/links to other dashboards
- wrote unit tests to make sure that the dashboard JSON is correct before deploying it
- corrected install/pip requirements that were missing
17-Jun-2020 (v29):
- experimental: re-runs app queries if any new query is updated, model update is run - this paves the way for reducing the number of polling requests being made, once more events are being sent from the FW server
- the app version dashboard now properly reflects the queries in the group 'Extra Metrics Queries - Apps', there is now one panel for each query.
- the app version dashboard now contains a quicklinks panel; allowing users to quickly get into the web UI for each of their app queries
- the server version check is now performed via a REST call instead of using local binaries and parsing that result
- changed to asyncio under the hood to allow for subscriptions to FW server events and removed dependancy on TimeLoop module
%package help
Summary: Development documents and examples for filewave-extra-metrics
Provides: python3-filewave-extra-metrics-doc
%description help
# FileWave Extra Metrics
The purpose of the Extra Metrics project is to augment a standard v14 FileWave installation with additional metrics and dashboard capabilities.
# Overview
Extra Metrics provides a series of dashboards and prometheus metrics related to how your fleets deployments are progressing. The information can be used to show "at-a-glance" insights into the software patch status, device health and user specific deployments.
In as many cases as possible the Dashboard panels are linked into the FileWave Web, making it easy to "drill down" into more detail and take action.
# What dashboards are created by Extra Metrics?
## Software Patch Status
What patches are available to be deployed? What is already being taken care of? How many devices are effected?
The software update (patch status) of clients is calculated using software update catalogs as well as information delivered by clients about the updates they require.

## Applications
What apps are up to date? Are many people making use of older, perhaps insecure apps?

The Extra Metrics program provides sample queries for some popular apps, they are stored as inventory queries in FileWave.
### Make your own app queries
Extra Metrics drives its dashboard from queries in FileWave.
Simply add new application queries into the 'Extra Metrics Queries - Apps' group and the Extra Metrics program will check them for required columns (app name + version) and include them automatically in this dashboard!
## Deployment
Which clients are not checking in quickly enough? Are all my clients using the latest version of the FileWave Client software? How many devices are being tracked or marked as missing? Am I exposed to security problems due to old OS versions?
The Deployment dashboard provides sample panels showing the devices grouped by client version, as well as a bar graph showing how frequently devices are checking in.

# Requirements / Check List
Minimum FileWave system requirements for success are as follows:
1. FileWave Version 14+ - it will not work with v13
1. FileWave Version 14+ must be running on a Linux Server
2. SSH Access to the FileWave Server
3. A base64 API Key specifically for Extra Metrics (with inventory and query *create* rights). You will require the base64 text, this can be obtained from the Manage Administrators -> Application tokens screen.
4. Make sure your server has SSL certificates - self signed certs are *not* enough.
5. You must have an externally reachable DNS name.
# Review before beginning installation
These instructions will have you install Extra Metrics directly on your FileWave Server within a python virtual environment.
Important:
> We *only* recommend installing Extra Metrics into its own python virtual environment. Doing so ensures that the introduction of this module cannot interfere with the operational integrity of your FileWave Server.
> DO NOT INSTALL EXTRA METRICS DIRECTLY INTO THE PYTHON RUNTIME ENVIRONMENT OF YOUR FILEWAVE SERVER.
> If you are unsure about the above statement - STOP - contact your FileWave SE or support. Your FileWave Server installation can be destroyed by mis-understanding the impact of this configuration.
Mac:
> On a Mac, you must install a version of Python that allows non-codesigned binaries to be installed into the Python environment. _On a Mac server: It is not possible to use the FileWave provided version of Python to run Extra Metrics_
## First Time Installation
Log into your FileWave Server using SSH, follow along to set up the virtual environment, install the Extra Metrics package and configure it. For the purpose of these instructions we are assuming a non-root user is being used.
Create a virtual environment for Extra Metrics:
$ /usr/local/filewave/python/bin/pyvenv $HOME/extra-metrics
$ source $HOME/extra-metrics/bin/activate
Now install the FileWave Extra Metrics package into the virtual environment:
(extra-metrics) $ pip install filewave-extra-metrics
Extra Metrics is now downloaded but not configured; before completing configuration you need an API Key (and SSL certs)
## Create & configure an Inventory API Key
Extra Metrics should be configured with an Inventory API Key in order to access Inventory and create the inventory groups and queries. You will need the base64 text version of this API Key, which can be obtained from the Manage Administrators -> Application tokens dialog in the FileWave Administrator console.
> Please create a unique access token (API Key) for the Extra Metrics module
## Configure Extra Metrics
The configuration step takes care of the following automatically:
- installation of a supervisord job to run the module
- installation of prometheus scrape configuration that targets the extra-metrics job
- installation & provisioning of 3 example dashboards into grafana
- upgrading grafana pie chart to the latest version
- storing the API key and DNS name
- dynamically injecting the external DNS name into the dashboards so that links to the FileWave web UI work correctly
> Note: the _extra-metrics-config_ command is part of the filewave-extra-metrics package; you will need the full path to this command if you are using sudo because sudo typically drops the existing PATH statement as a security measure.
> The key to running the extra-metrics-config command is that it must be run with root privs. If you are already logged in as root you can simply do the following:
$ extra-metrics-config -a my_base64_API_key_value -e my_filewave_server_dns_name
Use the following commands to configure the server properly (you need to re-run this if the DNS name or API key changes):
$ export CONFIG_PATH=`which extra-metrics-config`
$ export API_KEY='insert-your-api-key-here'
$ export DNS_NAME='dns-name-of-fw-server-here'
$ sudo $CONFIG_PATH --api-key $API_KEY --external-dns-name $DNS_NAME
[extra-metrics] [INFO] loading the configuration from file /usr/local/etc/filewave/extra_metrics.ini
[extra-metrics] [INFO] saved configuration to file: /usr/local/etc/filewave/extra_metrics.ini
[extra-metrics] [INFO] wrote dashboard file: /usr/local/etc/filewave/grafana/provisioning/dashboards/extra-metrics-Applications.json
[extra-metrics] [INFO] wrote dashboard file: /usr/local/etc/filewave/grafana/provisioning/dashboards/extra-metrics-Deployment.json
[extra-metrics] [INFO] wrote dashboard file: /usr/local/etc/filewave/grafana/provisioning/dashboards/extra-metrics-PatchStatus.json
[extra-metrics] [INFO]
[extra-metrics] [INFO] Configuration Summary
[extra-metrics] [INFO] =====================
[extra-metrics] [INFO] API Key: eZBlNWFlNTYwLTqZZWEtNDMwYS1iNTa0LTlmZTkxODFjOdaxNH6=
[extra-metrics] [INFO] External DNS: srv.cluster.tech
[extra-metrics] [INFO] detected FileWave instance running version: 14.0.0
## Restarting Services
If this is the first time you have installed the Extra Metrics module; you will need to tell supervisord to reload its configuration and to start the extra-metrics job.
$ /usr/local/filewave/python/bin/supervisorctl update
And you should restart Grafana so it can import the new dashboards.
$ fwcontrol dashboard restart
## Validating
> Note: it can take a few seconds (60 or so) for the metrics to be collected by prometheus and made available.
When you view the list of dashboards available in Grafana, you'll see 3 new ones - each with a 'patching' tag, as shown below:

## Upgrading Extra Metrics
To upgrade the Extra Metrics module; just run the install command again but include an '--upgrade' flag. It is recommended to run the "config" portion of the setup again to make sure that any configuration & dashboard panel changes have been applied as well and then restart services.
$ pip install --upgrade filewave-extra-metrics
$ sudo $CONFIG_PATH
$ /usr/local/filewave/python/bin/supervisorctl update
$ /usr/local/filewave/python/bin/supervisorctl restart extra_metrics
### Upgrading to a Release Candidate
To install a release candidate, run the install command again but include the '--pre' flag.
$ pip install --upgrade --pre filewave-extra-metrics
$ sudo $CONFIG_PATH
$ /usr/local/filewave/python/bin/supervisorctl update
$ /usr/local/filewave/python/bin/supervisorctl restart extra_metrics
# Misc.
## Hint: don't skip this - SSL Certs
Make sure you have an SSL certificate, it must be valid, trusted by everyone (not just the server) and absolutely under no circumstances should it be self signed.
Do this - you'll save yourself untold pain. Trust me I'm still healing.
## How can I be notified of updates?
Subscribe to this RSS feed: https://pypi.org/rss/project/filewave-extra-metrics/releases.xml
## Device Health - how is it calculated?
The whole fleet of devices is continuously sending data back to the FileWave Inventory system which is used to calculate device health.
The health of a device is calculated using three components:
1. Check-in days: the number of days since the device last checked into filewave
2. Disk free space: the proportion of free disk space left on the device
3. Patching; the number & type of patches still outstanding (based on what the client device has requested)
NOTE: The dashboard exposes a single state; but in reality the device has patch, check-in and disk state. *_The dashboard is simply exposing the WORST state overall._*
### Device Health Details
Checkin-days: If check-in days isn't known, the state is UNKNOWN. If it's < 7 the state is OK, < 14 the state is WARNING otherwise the state is ERROR
Disk space: If the disk space details are unknown the state is UNKNOWN, otherwise percentage disk space left is calculated (%left). If %left > 20% the state is OK, if %left is < 5% the state is ERROR otherwise the state is WARNING.
Patching: If there are any critical patches outstanding (unassigned, remaining or in an error / warning state), the state is ERROR. If there are any normal patches outstanding the state is WARNING. If there are no patches outstanding the device state is OK.
# What metrics are being exposed to prometheus?
## Metrics
extra_metrics_http_request_time_taken - REST queries made by extra metrics are timed; the response time is stored in a series of buckets within this metric.
extra_metrics_application_version - a summary of how many devices are using a particular app & version
extra_metrics_software_updates_by_state - buckets of all the software updates by state - the value is the number of devices in each state, this includes completed updates. The states are:
- Requested: total number of software updates requested (think of this as devices * updates)
- Unassigned: total number of software updates not assigned to a device (devices * updates)
- Assigned: the total number of updates associated / assigned to a device
- Remaining: the total number of updates that are in-progress that have yet to be completed
- Completed: the total number of completed updates
- Error / Warning: the total number of errors / warnings
extra_metrics_software_updates_by_critical - lists all the updates, indicating the number of normal vs critical updates currently known by the server.
extra_metrics_software_updates_by_popularity - list of software updates and the number of devices still needing the update (unassigned), completed updates are not included in this count.
extra_metrics_software_updates_by_age - list of software updates and their age in days, all updates including completed ones are included here. The value of the metric is the age in days (from now).
extra_metrics_software_updates_remaining_by_device - list of devices and the number of [critical] updates they have remaining to be installed, completed updates are not included in this count.
extra_metrics_devices_by_checkin_days - interesting stats on a per device basis, days since checked, compliance status.
extra_metrics_per_device_modelnum - provides a value of the model number per device.
extra_metrics_per_device_compliance - provides a value of the compliance state per device
extra_metrics_per_device_client_version - number of devices rolled up by client version
extra_metrics_per_device_platform - number of devices rolled up by platform
extra_metrics_per_device_tracked - number of devices being tracked
extra_metrics_per_device_locked - number of devices locked
### Reference
Adjust supervisorctl to include --storage.tsdb.allow-overlapping-blocks?
# Developers
To upload to PyPi, ensure you have the credentials in a pypi.config file (not checked into source control). To rebuild the package use ./rebuild_for_pypi.sh, to upload the package to PyPi use ./upload_to_pypi.sh.
An example pypi.config file contains:
```
[pypi]
username = __token__
password = pypi-AgEIcH.....<add your really long token here>
```
## Versioning
It can be very convenient to publish a release candidate to PyPi in order to make testing of the install scripts easier.
The versioning is controlled by the setup.py file.
```python
setuptools.setup(
name="filewave-extra-metrics",
version="1.0.36rc6"
```
Some things to rememeber:
1. if this is the first time you are pushing an RC - always increment the major revision first. For example, if the current revision is 1.0.35, then you should change the version for the RC to 1.0.36rc1
2. to upgrade installations with the currently published RC, use the following command:
$ pip install --upgrade --pre filewave-extra-metrics
# Changelog
07-Aug-2020 (v45)
- made the check-in days panel use log2 for the y-axis, smoothing out peaks in data
06-Aug-2020 (v44)
- adjusted health status such that devices that have not checked in are considered "Ok" instead of "Error"
- fixed the client query to return all device types; not just desktop devices - which makes device counts accurate across all the client metrics.
- fixed an issue that could result in duplicate queries being injected into the 'Extra Metrics Queries - Apps' reports group.
- added the ability to override logging (default level is now WARNING not INFO), use the env value EXTRA_METRICS_LOGLEVEL and specify DEBUG, INFO, ERROR or WARNING as appropriate.
- fixed up the device health mapping that caused some devices to appear as "Unknown".
- adjusted the health panel to be an instant query.
- adjusted the in-progress software patches panel to show everything except requested, assigned device data - resulting in a more natural view of the progress.
- adjusted the #patches / time panel to match the data in the in-progress software patches panel so they show data consistent with each other.
28-Jul-2020 (v43)
- fixed: datetime parse error in software updates due to differently formatted date data for mobile/desktops
01-Jul-2020 (v36)
- fixed: look for zmq_subscribe_curve.keypair in /usr/local/filewave/certs, events are now received for both compat and secure modes of FileWave Server.
- fixed: software update status is now driven entirely from a new web ui based endpoint which makes it possible to deliver a visualization of patch progress
- fixed: the 'health' metrics per device now make use of feedback from software update - so the number of critical vs normal patches outstanding impacts the health calculation
- fixed: bad/missing data caused a crash in some of the compliance calculations.
- new: additional log messages on startup to help describe why an abort might happen (bad api keys, no data returned from health checks)
- new: added unit tests for the software update aggregations via the web rest API
- changed: redefined the software update metrics to distinguish between completed patches, and everything else
23-Jun-2020 (v35)
- new (and experimental): works on Mac; but *requires* a brew installed Python instance; the built-in FileWave python 3.7 binaries will not work as they don't allow non codesigned PyPi packages to be installed. FileWave Extra Metrics uses numpy, which is unsigned.
- new option (--dont-verify-tls) for extra-metrics-config; turns off TLS verification - the change is stored in configuration
19-Jun-2020 (v32):
- new: configuration for the polling delay, default is 30m (but re-queries happen automatically on model update and query changes)
- new: work on making it possible to run this on a Mac server (experimental at this point)
- cleaned up links on the Patch Status dashboard and fixed the tags/links to other dashboards
- wrote unit tests to make sure that the dashboard JSON is correct before deploying it
- corrected install/pip requirements that were missing
17-Jun-2020 (v29):
- experimental: re-runs app queries if any new query is updated, model update is run - this paves the way for reducing the number of polling requests being made, once more events are being sent from the FW server
- the app version dashboard now properly reflects the queries in the group 'Extra Metrics Queries - Apps', there is now one panel for each query.
- the app version dashboard now contains a quicklinks panel; allowing users to quickly get into the web UI for each of their app queries
- the server version check is now performed via a REST call instead of using local binaries and parsing that result
- changed to asyncio under the hood to allow for subscriptions to FW server events and removed dependancy on TimeLoop module
%prep
%autosetup -n filewave-extra-metrics-1.0.46
%build
%py3_build
%install
%py3_install
install -d -m755 %{buildroot}/%{_pkgdocdir}
if [ -d doc ]; then cp -arf doc %{buildroot}/%{_pkgdocdir}; fi
if [ -d docs ]; then cp -arf docs %{buildroot}/%{_pkgdocdir}; fi
if [ -d example ]; then cp -arf example %{buildroot}/%{_pkgdocdir}; fi
if [ -d examples ]; then cp -arf examples %{buildroot}/%{_pkgdocdir}; fi
pushd %{buildroot}
if [ -d usr/lib ]; then
find usr/lib -type f -printf "\"/%h/%f\"\n" >> filelist.lst
fi
if [ -d usr/lib64 ]; then
find usr/lib64 -type f -printf "\"/%h/%f\"\n" >> filelist.lst
fi
if [ -d usr/bin ]; then
find usr/bin -type f -printf "\"/%h/%f\"\n" >> filelist.lst
fi
if [ -d usr/sbin ]; then
find usr/sbin -type f -printf "\"/%h/%f\"\n" >> filelist.lst
fi
touch doclist.lst
if [ -d usr/share/man ]; then
find usr/share/man -type f -printf "\"/%h/%f.gz\"\n" >> doclist.lst
fi
popd
mv %{buildroot}/filelist.lst .
mv %{buildroot}/doclist.lst .
%files -n python3-filewave-extra-metrics -f filelist.lst
%dir %{python3_sitelib}/*
%files help -f doclist.lst
%{_docdir}/*
%changelog
* Thu Jun 08 2023 Python_Bot <Python_Bot@openeuler.org> - 1.0.46-1
- Package Spec generated
|
