1
2
3
4
5
6
7
8
9
10
11
12
13
14
15
16
17
18
19
20
21
22
23
24
25
26
27
28
29
30
31
32
33
34
35
36
37
38
39
40
41
42
43
44
45
46
47
48
49
50
51
52
53
54
55
56
57
58
59
60
61
62
63
64
65
66
67
68
69
70
71
72
73
74
75
76
77
78
79
80
81
82
83
84
85
86
87
88
89
90
91
92
93
94
95
96
97
98
99
100
101
102
103
104
105
106
107
108
109
110
111
112
113
114
115
116
117
118
119
120
121
122
123
124
125
126
127
128
129
130
131
132
133
134
135
136
137
138
139
140
141
142
143
144
145
146
147
148
149
150
151
152
153
154
155
156
157
158
159
160
161
162
163
164
165
166
167
168
169
170
171
172
173
174
175
176
177
178
179
180
181
182
183
184
185
186
187
188
189
190
191
192
193
194
195
196
197
198
199
200
201
202
203
204
205
206
207
208
209
210
211
212
213
214
215
216
217
218
219
220
221
222
223
224
225
226
227
228
229
230
231
232
233
234
235
236
237
238
239
240
241
242
243
244
245
246
247
248
249
250
251
252
253
254
255
256
257
258
259
260
261
262
263
264
265
266
267
268
269
270
271
272
273
274
275
276
277
278
279
280
281
282
283
284
285
286
287
288
289
290
|
%global _empty_manifest_terminate_build 0
Name: python-finplot
Version: 1.9.1
Release: 1
Summary: Finance plotting
License: MIT License
URL: https://github.com/highfestiva/finplot
Source0: https://mirrors.nju.edu.cn/pypi/web/packages/a0/e8/0fb422079d92d26319c076b149da4731f9fc644a3dc219113b286a4356e6/finplot-1.9.1.tar.gz
BuildArch: noarch
Requires: python3-numpy
Requires: python3-pandas
Requires: python3-PyQt6
Requires: python3-pyqtgraph
Requires: python3-dateutil
%description
# Finance Plot
Finance Plotter, or finplot, is a performant library with a clean api to help you with your backtesting. It's
optionated with good defaults, so you can start doing your work without having to setup plots, colors, scales,
autoscaling, keybindings, handle panning+vertical zooming (which all non-finance libraries have problems with).
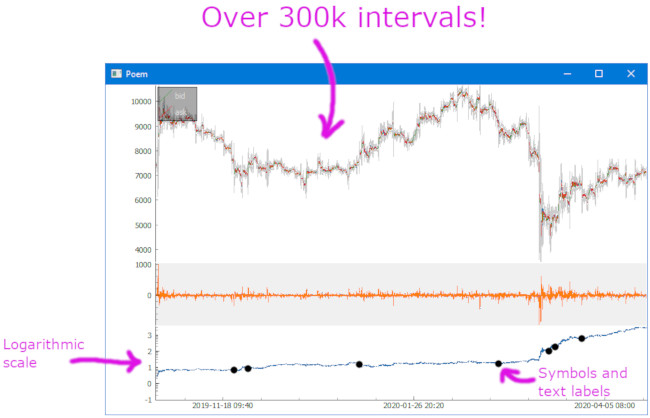
And best of all: it can show hundreds of thousands of datapoints without batting an eye.
<img src="https://badge.fury.io/py/finplot.svg"/> <img src="https://pepy.tech/badge/finplot/month"/> <img src="https://img.shields.io/badge/License-MIT-yellow.svg"/>
## Features
* Great performance compared to mpl_finance, plotly and Bokeh
* Clean api
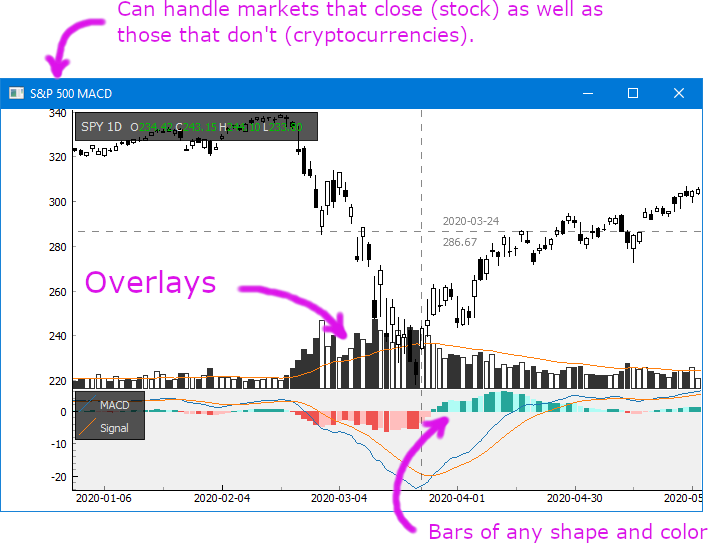
* Works with both stocks as well as cryptocurrencies on any time resolution
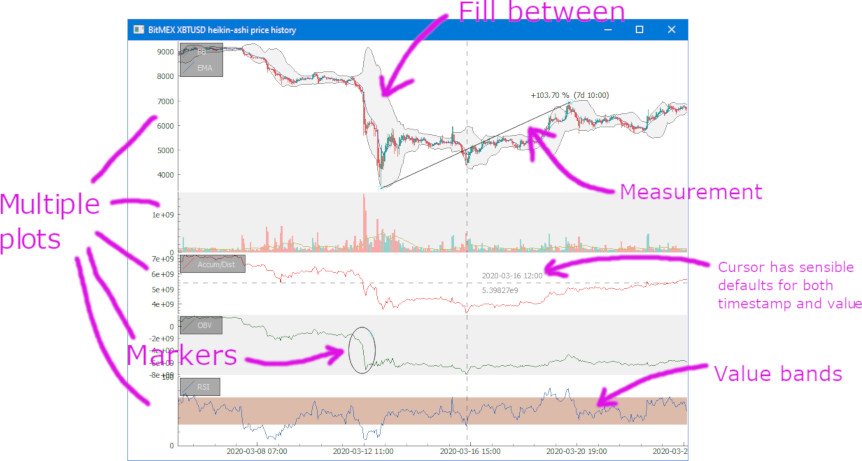
* Show as many charts as you want on the same time axis, zoom on all of them at once
* Auto-reload position where you were looking last run
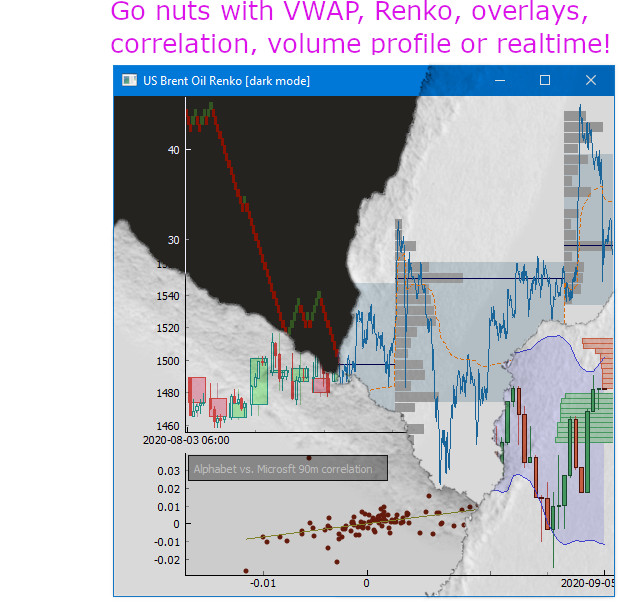
* Overlays, fill between, value bands, symbols, labels, legend, volume profile, heatmaps, etc.
* Can show real-time updates, including orderbook. Save screenshot.
* Comes with a [dozen](https://github.com/highfestiva/finplot/blob/master/finplot/examples) great examples.
## What it is not
finplot *is not a web app*. It does not help you create an homebrew exchange. It does not work with Jupyter Labs.
It is only intended for you to do backtesting in. That is not to say that you can't create a ticker or a trade
widget yourself. The library is based on the eminent pyqtgraph, which is fast and flexible, so feel free to hack
away if that's what you want.
## Easy installation
```bash
$ pip install finplot
```
## Example
It's straight-forward to start using. This shows every daily candle of Apple since the 80'ies:
```python
import finplot as fplt
import yfinance
df = yfinance.download('AAPL')
fplt.candlestick_ochl(df[['Open', 'Close', 'High', 'Low']])
fplt.show()
```
For more examples and a bunch of snippets, see the [examples](https://github.com/highfestiva/finplot/blob/master/finplot/examples/)
directory or the [wiki](https://github.com/highfestiva/finplot/wiki). There you'll find how to plot MACD, Parabolic SAR, RSI,
volume profile and much more.
## Coffee
For future support and features, consider a small donation.
BTC: bc1qk8m8yh86l2pz4eypflchr0tkn5aeud6cmt426m
ETH: 0x684d7d4C52ed428AE9a36B2407ba909D896cDB67
%package -n python3-finplot
Summary: Finance plotting
Provides: python-finplot
BuildRequires: python3-devel
BuildRequires: python3-setuptools
BuildRequires: python3-pip
%description -n python3-finplot
# Finance Plot
Finance Plotter, or finplot, is a performant library with a clean api to help you with your backtesting. It's
optionated with good defaults, so you can start doing your work without having to setup plots, colors, scales,
autoscaling, keybindings, handle panning+vertical zooming (which all non-finance libraries have problems with).
And best of all: it can show hundreds of thousands of datapoints without batting an eye.
<img src="https://badge.fury.io/py/finplot.svg"/> <img src="https://pepy.tech/badge/finplot/month"/> <img src="https://img.shields.io/badge/License-MIT-yellow.svg"/>
## Features
* Great performance compared to mpl_finance, plotly and Bokeh
* Clean api
* Works with both stocks as well as cryptocurrencies on any time resolution
* Show as many charts as you want on the same time axis, zoom on all of them at once
* Auto-reload position where you were looking last run
* Overlays, fill between, value bands, symbols, labels, legend, volume profile, heatmaps, etc.
* Can show real-time updates, including orderbook. Save screenshot.
* Comes with a [dozen](https://github.com/highfestiva/finplot/blob/master/finplot/examples) great examples.


## What it is not
finplot *is not a web app*. It does not help you create an homebrew exchange. It does not work with Jupyter Labs.
It is only intended for you to do backtesting in. That is not to say that you can't create a ticker or a trade
widget yourself. The library is based on the eminent pyqtgraph, which is fast and flexible, so feel free to hack
away if that's what you want.
## Easy installation
```bash
$ pip install finplot
```
## Example
It's straight-forward to start using. This shows every daily candle of Apple since the 80'ies:
```python
import finplot as fplt
import yfinance
df = yfinance.download('AAPL')
fplt.candlestick_ochl(df[['Open', 'Close', 'High', 'Low']])
fplt.show()
```
For more examples and a bunch of snippets, see the [examples](https://github.com/highfestiva/finplot/blob/master/finplot/examples/)
directory or the [wiki](https://github.com/highfestiva/finplot/wiki). There you'll find how to plot MACD, Parabolic SAR, RSI,
volume profile and much more.
## Coffee
For future support and features, consider a small donation.
BTC: bc1qk8m8yh86l2pz4eypflchr0tkn5aeud6cmt426m
ETH: 0x684d7d4C52ed428AE9a36B2407ba909D896cDB67
%package help
Summary: Development documents and examples for finplot
Provides: python3-finplot-doc
%description help
# Finance Plot
Finance Plotter, or finplot, is a performant library with a clean api to help you with your backtesting. It's
optionated with good defaults, so you can start doing your work without having to setup plots, colors, scales,
autoscaling, keybindings, handle panning+vertical zooming (which all non-finance libraries have problems with).
And best of all: it can show hundreds of thousands of datapoints without batting an eye.
<img src="https://badge.fury.io/py/finplot.svg"/> <img src="https://pepy.tech/badge/finplot/month"/> <img src="https://img.shields.io/badge/License-MIT-yellow.svg"/>
## Features
* Great performance compared to mpl_finance, plotly and Bokeh
* Clean api
* Works with both stocks as well as cryptocurrencies on any time resolution
* Show as many charts as you want on the same time axis, zoom on all of them at once
* Auto-reload position where you were looking last run
* Overlays, fill between, value bands, symbols, labels, legend, volume profile, heatmaps, etc.
* Can show real-time updates, including orderbook. Save screenshot.
* Comes with a [dozen](https://github.com/highfestiva/finplot/blob/master/finplot/examples) great examples.


## What it is not
finplot *is not a web app*. It does not help you create an homebrew exchange. It does not work with Jupyter Labs.
It is only intended for you to do backtesting in. That is not to say that you can't create a ticker or a trade
widget yourself. The library is based on the eminent pyqtgraph, which is fast and flexible, so feel free to hack
away if that's what you want.
## Easy installation
```bash
$ pip install finplot
```
## Example
It's straight-forward to start using. This shows every daily candle of Apple since the 80'ies:
```python
import finplot as fplt
import yfinance
df = yfinance.download('AAPL')
fplt.candlestick_ochl(df[['Open', 'Close', 'High', 'Low']])
fplt.show()
```
For more examples and a bunch of snippets, see the [examples](https://github.com/highfestiva/finplot/blob/master/finplot/examples/)
directory or the [wiki](https://github.com/highfestiva/finplot/wiki). There you'll find how to plot MACD, Parabolic SAR, RSI,
volume profile and much more.
## Coffee
For future support and features, consider a small donation.
BTC: bc1qk8m8yh86l2pz4eypflchr0tkn5aeud6cmt426m
ETH: 0x684d7d4C52ed428AE9a36B2407ba909D896cDB67
%prep
%autosetup -n finplot-1.9.1
%build
%py3_build
%install
%py3_install
install -d -m755 %{buildroot}/%{_pkgdocdir}
if [ -d doc ]; then cp -arf doc %{buildroot}/%{_pkgdocdir}; fi
if [ -d docs ]; then cp -arf docs %{buildroot}/%{_pkgdocdir}; fi
if [ -d example ]; then cp -arf example %{buildroot}/%{_pkgdocdir}; fi
if [ -d examples ]; then cp -arf examples %{buildroot}/%{_pkgdocdir}; fi
pushd %{buildroot}
if [ -d usr/lib ]; then
find usr/lib -type f -printf "\"/%h/%f\"\n" >> filelist.lst
fi
if [ -d usr/lib64 ]; then
find usr/lib64 -type f -printf "\"/%h/%f\"\n" >> filelist.lst
fi
if [ -d usr/bin ]; then
find usr/bin -type f -printf "\"/%h/%f\"\n" >> filelist.lst
fi
if [ -d usr/sbin ]; then
find usr/sbin -type f -printf "\"/%h/%f\"\n" >> filelist.lst
fi
touch doclist.lst
if [ -d usr/share/man ]; then
find usr/share/man -type f -printf "\"/%h/%f.gz\"\n" >> doclist.lst
fi
popd
mv %{buildroot}/filelist.lst .
mv %{buildroot}/doclist.lst .
%files -n python3-finplot -f filelist.lst
%dir %{python3_sitelib}/*
%files help -f doclist.lst
%{_docdir}/*
%changelog
* Thu Jun 08 2023 Python_Bot <Python_Bot@openeuler.org> - 1.9.1-1
- Package Spec generated
|
