diff options
Diffstat (limited to 'python-flask-prometheus-metrics.spec')
| -rw-r--r-- | python-flask-prometheus-metrics.spec | 545 |
1 files changed, 545 insertions, 0 deletions
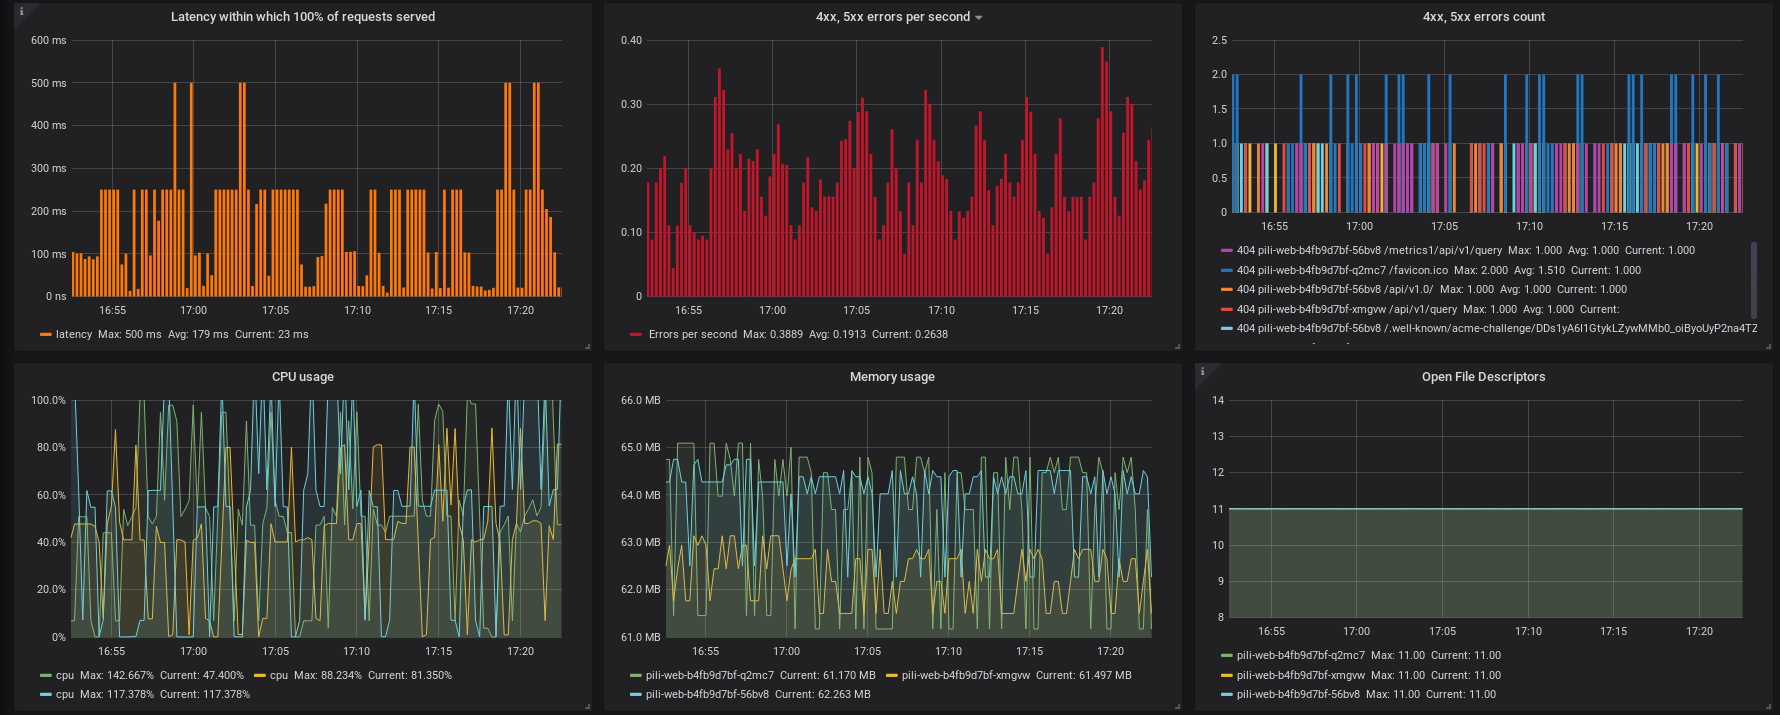
diff --git a/python-flask-prometheus-metrics.spec b/python-flask-prometheus-metrics.spec new file mode 100644 index 0000000..c48d6b5 --- /dev/null +++ b/python-flask-prometheus-metrics.spec @@ -0,0 +1,545 @@ +%global _empty_manifest_terminate_build 0 +Name: python-flask-prometheus-metrics +Version: 1.0.0 +Release: 1 +Summary: Prometheus Metrics for Flask Web App +License: MIT +URL: https://github.com/pilosus/flask_prometheus_metrics/ +Source0: https://mirrors.nju.edu.cn/pypi/web/packages/74/a2/83a59fb33c2024dff49d6a493cced94c34d57fbfe6ee1fa5e90faf86df90/flask_prometheus_metrics-1.0.0.tar.gz +BuildArch: noarch + +Requires: python3-prometheus-client +Requires: python3-Flask + +%description +## Flask Prometheus Metrics ## + +[](https://travis-ci.org/pilosus/flask_prometheus_metrics) +[](https://codeclimate.com/github/pilosus/flask_prometheus_metrics/test_coverage) +[](https://codeclimate.com/github/pilosus/flask_prometheus_metrics/maintainability) +[](https://github.com/python/black) + +Prometheus metrics exporter for Flask web applications. + +``flask_prometheus_metrics`` uses official [Prometheus Python Client](https://github.com/prometheus/client_python) +providing basic metrics about process resource usage, app's requests metrics and information. + + +## Installation ## + +```bash +pip install -U flask_prometheus_metrics +``` + +You will need ``Flask`` to run examples below: + +```bash +pip install -U 'flask_prometheus_metrics[flask]' +``` + +## Usage ## + +Run the following minimal example in Python shell: + +```python +from flask import Flask +from prometheus_client import make_wsgi_app +from werkzeug.middleware.dispatcher import DispatcherMiddleware +from werkzeug.serving import run_simple +from flask_prometheus_metrics import register_metrics + +app = Flask(__name__) + +@app.route("/") +def index(): + return "Test" + +# provide app's version and deploy environment/config name to set a gauge metric +register_metrics(app, app_version="v0.1.2", app_config="staging") + +# Plug metrics WSGI app to your main app with dispatcher +dispatcher = DispatcherMiddleware(app.wsgi_app, {"/metrics": make_wsgi_app()}) + +run_simple(hostname="localhost", port=5000, application=dispatcher) +``` + +Then go over ``http://localhost:5000/``, refresh page a few times and check your +app's metrics at ``http://localhost:5000/metrics``. + +See also [example.py](https://github.com/pilosus/flask_prometheus_metrics/blob/master/flask_prometheus_metrics/example.py) +for more elaborate example of library usage in real Flask applications. + +## Metrics ## + +``flask_prometheus_metrics`` exposes the following application metrics: + +- ``app_request_latency_seconds`` (histogram) - Application request latency +- ``app_request_count_total`` (counter) - application request count +- ``app_version_info`` (gauge) - application version + +Library also provides some metrics about a Python interpreter used and process +resource usage: + +- ``python_gc_objects_collected_total`` (counter) - objects collected during gc +- ``python_gc_objects_uncollectable_total`` (counter) - uncollectable object found during GC +- ``python_gc_collections_total`` (counter) - number of times this generation was collected +- ``python_info`` (gauge) - Python platform information +- ``process_virtual_memory_bytes`` (gauge) - virtual memory size in bytes +- ``process_resident_memory_bytes`` (gauge) - resident memory size in bytes +- ``process_start_time_seconds`` (gauge) - start time of the process since unix epoch in seconds +- ``process_cpu_seconds_total`` (counter) - total user and system CPU time spent in seconds +- ``process_open_fds`` (gauge) - number of open file descriptors +- ``process_max_fds`` (gauge) - maximum number of open file descriptors + +## Grafana dashboard ## + +The metrics exported by ``flask_prometheus_metrics`` can be scraped by +[Prometheus](https://prometheus.io/) monitoring system and then visualized in +[Grafana](https://grafana.com/). + +You can download Grafana dashboard crafted specifically for the ``flask_prometheus_metrics`` +default metrics [here](https://github.com/pilosus/prometheus-client-python-app-grafana-dashboard/). + +[](https://github.com/pilosus/prometheus-client-python-app-grafana-dashboard/) + + +## Testing ## + +When testing Flask application with ``DispatcherMiddleware`` (see Usage example above) +you may want to use a [little hack](https://github.com/pilosus/flask_prometheus_metrics/blob/master/tests/conftest.py#L22) +in order to make Flask's ``test_client()`` work properly. + + +## History ## + +### v1.0.0 (2019-06-06) ### +* Library is ready for production +* Minor setup.py fixes (#12) + + +### v0.7.0 (2019-06-06) ### +* README.md adjusted to work both on GitHub and PyPi (#11) + + +### v0.6.2 (2019-06-06) ### +* Codeclimate integration added + + +### v0.6.1 (2019-06-06) ### +* Travis CI configuration fixed + + +### v0.6.0 (2019-06-06) ### +* README and CHANGELOG as long description added + + +### v0.5.0 (2019-06-06) ### +* CHANGELOG.md added + + +### v0.4.0 (2019-06-06) ### +* Import simplified for metrics registration function + + +### v0.3.1 (2019-06-05) ### +* Minor CI config fix + + +### v0.3.0 (2019-06-05) ### +* Dependencies versions and safety checks added + + +### v0.2.1 (2019-06-01) ### +* Update installation example in README + + +### v0.2.0 (2019-06-01) ### +* README added, some code refactoring + + +### v0.1.2 (2019-06-01) ### +* Version bumped + + +### v0.1.1 (2019-06-01) ### +* Package versioning fix + + +### v0.1.0 (2019-06-01) ### +* MVP + + + + +%package -n python3-flask-prometheus-metrics +Summary: Prometheus Metrics for Flask Web App +Provides: python-flask-prometheus-metrics +BuildRequires: python3-devel +BuildRequires: python3-setuptools +BuildRequires: python3-pip +%description -n python3-flask-prometheus-metrics +## Flask Prometheus Metrics ## + +[](https://travis-ci.org/pilosus/flask_prometheus_metrics) +[](https://codeclimate.com/github/pilosus/flask_prometheus_metrics/test_coverage) +[](https://codeclimate.com/github/pilosus/flask_prometheus_metrics/maintainability) +[](https://github.com/python/black) + +Prometheus metrics exporter for Flask web applications. + +``flask_prometheus_metrics`` uses official [Prometheus Python Client](https://github.com/prometheus/client_python) +providing basic metrics about process resource usage, app's requests metrics and information. + + +## Installation ## + +```bash +pip install -U flask_prometheus_metrics +``` + +You will need ``Flask`` to run examples below: + +```bash +pip install -U 'flask_prometheus_metrics[flask]' +``` + +## Usage ## + +Run the following minimal example in Python shell: + +```python +from flask import Flask +from prometheus_client import make_wsgi_app +from werkzeug.middleware.dispatcher import DispatcherMiddleware +from werkzeug.serving import run_simple +from flask_prometheus_metrics import register_metrics + +app = Flask(__name__) + +@app.route("/") +def index(): + return "Test" + +# provide app's version and deploy environment/config name to set a gauge metric +register_metrics(app, app_version="v0.1.2", app_config="staging") + +# Plug metrics WSGI app to your main app with dispatcher +dispatcher = DispatcherMiddleware(app.wsgi_app, {"/metrics": make_wsgi_app()}) + +run_simple(hostname="localhost", port=5000, application=dispatcher) +``` + +Then go over ``http://localhost:5000/``, refresh page a few times and check your +app's metrics at ``http://localhost:5000/metrics``. + +See also [example.py](https://github.com/pilosus/flask_prometheus_metrics/blob/master/flask_prometheus_metrics/example.py) +for more elaborate example of library usage in real Flask applications. + +## Metrics ## + +``flask_prometheus_metrics`` exposes the following application metrics: + +- ``app_request_latency_seconds`` (histogram) - Application request latency +- ``app_request_count_total`` (counter) - application request count +- ``app_version_info`` (gauge) - application version + +Library also provides some metrics about a Python interpreter used and process +resource usage: + +- ``python_gc_objects_collected_total`` (counter) - objects collected during gc +- ``python_gc_objects_uncollectable_total`` (counter) - uncollectable object found during GC +- ``python_gc_collections_total`` (counter) - number of times this generation was collected +- ``python_info`` (gauge) - Python platform information +- ``process_virtual_memory_bytes`` (gauge) - virtual memory size in bytes +- ``process_resident_memory_bytes`` (gauge) - resident memory size in bytes +- ``process_start_time_seconds`` (gauge) - start time of the process since unix epoch in seconds +- ``process_cpu_seconds_total`` (counter) - total user and system CPU time spent in seconds +- ``process_open_fds`` (gauge) - number of open file descriptors +- ``process_max_fds`` (gauge) - maximum number of open file descriptors + +## Grafana dashboard ## + +The metrics exported by ``flask_prometheus_metrics`` can be scraped by +[Prometheus](https://prometheus.io/) monitoring system and then visualized in +[Grafana](https://grafana.com/). + +You can download Grafana dashboard crafted specifically for the ``flask_prometheus_metrics`` +default metrics [here](https://github.com/pilosus/prometheus-client-python-app-grafana-dashboard/). + +[](https://github.com/pilosus/prometheus-client-python-app-grafana-dashboard/) + + +## Testing ## + +When testing Flask application with ``DispatcherMiddleware`` (see Usage example above) +you may want to use a [little hack](https://github.com/pilosus/flask_prometheus_metrics/blob/master/tests/conftest.py#L22) +in order to make Flask's ``test_client()`` work properly. + + +## History ## + +### v1.0.0 (2019-06-06) ### +* Library is ready for production +* Minor setup.py fixes (#12) + + +### v0.7.0 (2019-06-06) ### +* README.md adjusted to work both on GitHub and PyPi (#11) + + +### v0.6.2 (2019-06-06) ### +* Codeclimate integration added + + +### v0.6.1 (2019-06-06) ### +* Travis CI configuration fixed + + +### v0.6.0 (2019-06-06) ### +* README and CHANGELOG as long description added + + +### v0.5.0 (2019-06-06) ### +* CHANGELOG.md added + + +### v0.4.0 (2019-06-06) ### +* Import simplified for metrics registration function + + +### v0.3.1 (2019-06-05) ### +* Minor CI config fix + + +### v0.3.0 (2019-06-05) ### +* Dependencies versions and safety checks added + + +### v0.2.1 (2019-06-01) ### +* Update installation example in README + + +### v0.2.0 (2019-06-01) ### +* README added, some code refactoring + + +### v0.1.2 (2019-06-01) ### +* Version bumped + + +### v0.1.1 (2019-06-01) ### +* Package versioning fix + + +### v0.1.0 (2019-06-01) ### +* MVP + + + + +%package help +Summary: Development documents and examples for flask-prometheus-metrics +Provides: python3-flask-prometheus-metrics-doc +%description help +## Flask Prometheus Metrics ## + +[](https://travis-ci.org/pilosus/flask_prometheus_metrics) +[](https://codeclimate.com/github/pilosus/flask_prometheus_metrics/test_coverage) +[](https://codeclimate.com/github/pilosus/flask_prometheus_metrics/maintainability) +[](https://github.com/python/black) + +Prometheus metrics exporter for Flask web applications. + +``flask_prometheus_metrics`` uses official [Prometheus Python Client](https://github.com/prometheus/client_python) +providing basic metrics about process resource usage, app's requests metrics and information. + + +## Installation ## + +```bash +pip install -U flask_prometheus_metrics +``` + +You will need ``Flask`` to run examples below: + +```bash +pip install -U 'flask_prometheus_metrics[flask]' +``` + +## Usage ## + +Run the following minimal example in Python shell: + +```python +from flask import Flask +from prometheus_client import make_wsgi_app +from werkzeug.middleware.dispatcher import DispatcherMiddleware +from werkzeug.serving import run_simple +from flask_prometheus_metrics import register_metrics + +app = Flask(__name__) + +@app.route("/") +def index(): + return "Test" + +# provide app's version and deploy environment/config name to set a gauge metric +register_metrics(app, app_version="v0.1.2", app_config="staging") + +# Plug metrics WSGI app to your main app with dispatcher +dispatcher = DispatcherMiddleware(app.wsgi_app, {"/metrics": make_wsgi_app()}) + +run_simple(hostname="localhost", port=5000, application=dispatcher) +``` + +Then go over ``http://localhost:5000/``, refresh page a few times and check your +app's metrics at ``http://localhost:5000/metrics``. + +See also [example.py](https://github.com/pilosus/flask_prometheus_metrics/blob/master/flask_prometheus_metrics/example.py) +for more elaborate example of library usage in real Flask applications. + +## Metrics ## + +``flask_prometheus_metrics`` exposes the following application metrics: + +- ``app_request_latency_seconds`` (histogram) - Application request latency +- ``app_request_count_total`` (counter) - application request count +- ``app_version_info`` (gauge) - application version + +Library also provides some metrics about a Python interpreter used and process +resource usage: + +- ``python_gc_objects_collected_total`` (counter) - objects collected during gc +- ``python_gc_objects_uncollectable_total`` (counter) - uncollectable object found during GC +- ``python_gc_collections_total`` (counter) - number of times this generation was collected +- ``python_info`` (gauge) - Python platform information +- ``process_virtual_memory_bytes`` (gauge) - virtual memory size in bytes +- ``process_resident_memory_bytes`` (gauge) - resident memory size in bytes +- ``process_start_time_seconds`` (gauge) - start time of the process since unix epoch in seconds +- ``process_cpu_seconds_total`` (counter) - total user and system CPU time spent in seconds +- ``process_open_fds`` (gauge) - number of open file descriptors +- ``process_max_fds`` (gauge) - maximum number of open file descriptors + +## Grafana dashboard ## + +The metrics exported by ``flask_prometheus_metrics`` can be scraped by +[Prometheus](https://prometheus.io/) monitoring system and then visualized in +[Grafana](https://grafana.com/). + +You can download Grafana dashboard crafted specifically for the ``flask_prometheus_metrics`` +default metrics [here](https://github.com/pilosus/prometheus-client-python-app-grafana-dashboard/). + +[](https://github.com/pilosus/prometheus-client-python-app-grafana-dashboard/) + + +## Testing ## + +When testing Flask application with ``DispatcherMiddleware`` (see Usage example above) +you may want to use a [little hack](https://github.com/pilosus/flask_prometheus_metrics/blob/master/tests/conftest.py#L22) +in order to make Flask's ``test_client()`` work properly. + + +## History ## + +### v1.0.0 (2019-06-06) ### +* Library is ready for production +* Minor setup.py fixes (#12) + + +### v0.7.0 (2019-06-06) ### +* README.md adjusted to work both on GitHub and PyPi (#11) + + +### v0.6.2 (2019-06-06) ### +* Codeclimate integration added + + +### v0.6.1 (2019-06-06) ### +* Travis CI configuration fixed + + +### v0.6.0 (2019-06-06) ### +* README and CHANGELOG as long description added + + +### v0.5.0 (2019-06-06) ### +* CHANGELOG.md added + + +### v0.4.0 (2019-06-06) ### +* Import simplified for metrics registration function + + +### v0.3.1 (2019-06-05) ### +* Minor CI config fix + + +### v0.3.0 (2019-06-05) ### +* Dependencies versions and safety checks added + + +### v0.2.1 (2019-06-01) ### +* Update installation example in README + + +### v0.2.0 (2019-06-01) ### +* README added, some code refactoring + + +### v0.1.2 (2019-06-01) ### +* Version bumped + + +### v0.1.1 (2019-06-01) ### +* Package versioning fix + + +### v0.1.0 (2019-06-01) ### +* MVP + + + + +%prep +%autosetup -n flask-prometheus-metrics-1.0.0 + +%build +%py3_build + +%install +%py3_install +install -d -m755 %{buildroot}/%{_pkgdocdir} +if [ -d doc ]; then cp -arf doc %{buildroot}/%{_pkgdocdir}; fi +if [ -d docs ]; then cp -arf docs %{buildroot}/%{_pkgdocdir}; fi +if [ -d example ]; then cp -arf example %{buildroot}/%{_pkgdocdir}; fi +if [ -d examples ]; then cp -arf examples %{buildroot}/%{_pkgdocdir}; fi +pushd %{buildroot} +if [ -d usr/lib ]; then + find usr/lib -type f -printf "/%h/%f\n" >> filelist.lst +fi +if [ -d usr/lib64 ]; then + find usr/lib64 -type f -printf "/%h/%f\n" >> filelist.lst +fi +if [ -d usr/bin ]; then + find usr/bin -type f -printf "/%h/%f\n" >> filelist.lst +fi +if [ -d usr/sbin ]; then + find usr/sbin -type f -printf "/%h/%f\n" >> filelist.lst +fi +touch doclist.lst +if [ -d usr/share/man ]; then + find usr/share/man -type f -printf "/%h/%f.gz\n" >> doclist.lst +fi +popd +mv %{buildroot}/filelist.lst . +mv %{buildroot}/doclist.lst . + +%files -n python3-flask-prometheus-metrics -f filelist.lst +%dir %{python3_sitelib}/* + +%files help -f doclist.lst +%{_docdir}/* + +%changelog +* Wed May 31 2023 Python_Bot <Python_Bot@openeuler.org> - 1.0.0-1 +- Package Spec generated |
