
diff options
| -rw-r--r-- | .gitignore | 1 | ||||
| -rw-r--r-- | python-interactive-kit.spec | 291 | ||||
| -rw-r--r-- | sources | 1 |
3 files changed, 293 insertions, 0 deletions
@@ -0,0 +1 @@ +/interactive-kit-0.1.6.tar.gz diff --git a/python-interactive-kit.spec b/python-interactive-kit.spec new file mode 100644 index 0000000..ddebc3d --- /dev/null +++ b/python-interactive-kit.spec @@ -0,0 +1,291 @@ +%global _empty_manifest_terminate_build 0 +Name: python-interactive-kit +Version: 0.1.6 +Release: 1 +Summary: Interactive viewer for signal processing, image processing, and machine learning +License: MIT License +URL: https://github.com/Biomedical-Imaging-Group/interactive-kit +Source0: https://mirrors.aliyun.com/pypi/web/packages/d2/34/1d6985e90edbfe83dec7f9734c243a073ac30da58cb9898bcbf99d3fa309/interactive-kit-0.1.6.tar.gz +BuildArch: noarch + +Requires: python3-numpy +Requires: python3-matplotlib +Requires: python3-jupyter +Requires: python3-ipympl +Requires: python3-ipywidgets +Requires: python3-opencv-python + +%description +# `interactive-kit` + +A toolkit for interactive visualization of signal and image processing on [Jupyter](https://jupyter.org/) Notebooks. + + + +`interactive-kit` was created to simplify visualization in image and signal processing teaching, learning and research. Using [Jupyter](https://jupyter.org/) Notebooks in combination with `interactive-kit` a user with virtually no programming experience, or without any experience with `matplotlib`, will be able to display and manipulate one or several signals or images and interactively explore them. It is even possible to extract information and perform operations directly on the signal or image without the need to re-run the cell or to plot again. + +The class is designed to run in Jupyter Notebooks or Jupyter Lab, using `matplotlib`'s dynamic widget-based environment ([`ipympl`](https://github.com/matplotlib/ipympl)), which needs to be activated with the magic command `%matplotlib widget`. All the functionalities are controlled either through `matplotlib`'s native widgets (zoom, pan, and change of figure size) or through additional `ipywidgets`-based buttons and sliders. + +## Modules + +#### **Image Viewer** (`imviewer`) + +Optimized for image visualization and manipulation. See the dedicated [tutorial](https://github.com/Biomedical-Imaging-Group/interactive-kit/tree/master/tutorials/ImageViewer_Tutorial.ipynb) and [wiki](https://github.com/Biomedical-Imaging-Group/interactive-kit/wiki/Image-Viewer). + +##### Main features +Once called, from the `imviewer` and using both widgets and programmatic commands, a user will be able to: + +* Plot several images at the same time, and choose different display options (one image at a time, or a customized grid of images), +* Change the brightness and contrast of the images through a slider, +* Explore the histogram of the image, +* Choose different colormaps and visualization options (colorbar, axis), +* Get 1st and 2nd order statistics -updated automatically when zooming into a region- of the image, +* Calculate and visualize differences between two different images, +* Declare functions that perform operations on an image, and through custom widgets, see the effect of the function with different parameters applied on different images, directly inside the `imviewer` object. + + +#### **Signal Viewer** (`sigviewer`) +Optimized for 1-dimensional signal visualization and manipulation. See the dedicated [tutorial](https://github.com/Biomedical-Imaging-Group/interactive-kit/tree/master/tutorials/SignalViewer_Tutorial.ipynb) and [wiki](https://github.com/Biomedical-Imaging-Group/interactive-kit/wiki/Signal-Viewer). + +<!-- ### **Decision Boundary Viewer** (`boundviewer`) --> +## Installation and usage +First, make sure you have installed Python 3.6 or higher. Then, `interactive-kit` can easily be installed through PyPI: + +``` +pip install interactive-kit==0.1rc3 +``` + +To use in a jupyter notebook, you can import the modules in the following way: + +```python +from interactive_kit import imviewer, sigviewer +``` + +## Team +The viewer was developed at the [EPFL's Biomedical Imaging Group](https://bigwww.epfl.ch/), mainly by + +* Alejandro Noguerón Aramburu (alejandro.nogueronaramburu@epfl.ch, [Alejandro-1996](https://github.com/Alejandro-1996)) + +with contributions from + +* Kay Lächler (kay.lachler@epfl.ch, [TheUser0571](https://github.com/TheUser0571)) +* [Pol del Aguila Pla](https://poldap.github.io), (pol.delaguilapla@epfl.ch, [poldap](https://github.com/poldap)) +* [Daniel Sage ](http://bigwww.epfl.ch/sage/index.html), (daniel.sage@epfl.ch, [dasv74](https://github.com/dasv74)) + +The development of the viewer was supported by the [Digital Resources for Instruction and Learning (DRIL) Fund](https://www.epfl.ch/education/educational-initiatives/cede/digitaltools/dril/) at EPFL, which supported the projects _IPLAB – Image Processing Laboratories on Noto_ and _FeedbackNow – Automatic grading and formative feedback for image processing laboratories_ by Pol del Aguila Pla and Daniel Sage in the sprint and fall semesters of 2020, respectively. See the video below for more information. + +[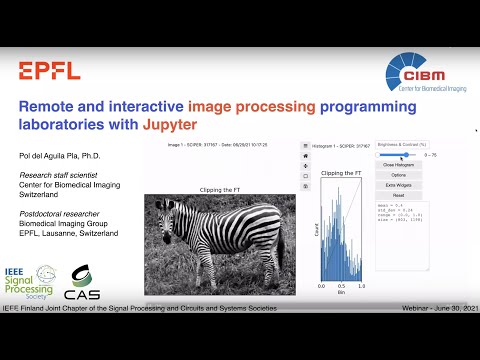](http://www.youtube.com/watch?v=AF18wN37B6Q "Image Processing Labs with Jupyter") + +### Members of the EPFL community + +If you want to start using `interactive-kit` rightaway, without going through the process of installing Python and Jupyter, you can [click here](https://noto.epfl.ch/hub/user-redirect/git-pull?repo=https%3A%2F%2Fgithub.com%2FBiomedical-Imaging-Group%2FIPLabImageViewer&urlpath=tree%2FIPLabImageViewer%2FIPLabViewer_Tutorial.ipynb&branch=master) and start using right away from [Noto](https://www.epfl.ch/education/educational-initiatives/cede/digitaltools/noto/), EPFL's Jupyter centralized platform. + +## Contributions + +We appreciate contributions, feedback and bug reports from the community: +* If you encounter any bug, please open an issue and describe. We will try to fix it or give you a workaround as soon as possible. +* If you wish to contribute, fork the repository and then open a pull request. + + + + +%package -n python3-interactive-kit +Summary: Interactive viewer for signal processing, image processing, and machine learning +Provides: python-interactive-kit +BuildRequires: python3-devel +BuildRequires: python3-setuptools +BuildRequires: python3-pip +%description -n python3-interactive-kit +# `interactive-kit` + +A toolkit for interactive visualization of signal and image processing on [Jupyter](https://jupyter.org/) Notebooks. + + + +`interactive-kit` was created to simplify visualization in image and signal processing teaching, learning and research. Using [Jupyter](https://jupyter.org/) Notebooks in combination with `interactive-kit` a user with virtually no programming experience, or without any experience with `matplotlib`, will be able to display and manipulate one or several signals or images and interactively explore them. It is even possible to extract information and perform operations directly on the signal or image without the need to re-run the cell or to plot again. + +The class is designed to run in Jupyter Notebooks or Jupyter Lab, using `matplotlib`'s dynamic widget-based environment ([`ipympl`](https://github.com/matplotlib/ipympl)), which needs to be activated with the magic command `%matplotlib widget`. All the functionalities are controlled either through `matplotlib`'s native widgets (zoom, pan, and change of figure size) or through additional `ipywidgets`-based buttons and sliders. + +## Modules + +#### **Image Viewer** (`imviewer`) + +Optimized for image visualization and manipulation. See the dedicated [tutorial](https://github.com/Biomedical-Imaging-Group/interactive-kit/tree/master/tutorials/ImageViewer_Tutorial.ipynb) and [wiki](https://github.com/Biomedical-Imaging-Group/interactive-kit/wiki/Image-Viewer). + +##### Main features +Once called, from the `imviewer` and using both widgets and programmatic commands, a user will be able to: + +* Plot several images at the same time, and choose different display options (one image at a time, or a customized grid of images), +* Change the brightness and contrast of the images through a slider, +* Explore the histogram of the image, +* Choose different colormaps and visualization options (colorbar, axis), +* Get 1st and 2nd order statistics -updated automatically when zooming into a region- of the image, +* Calculate and visualize differences between two different images, +* Declare functions that perform operations on an image, and through custom widgets, see the effect of the function with different parameters applied on different images, directly inside the `imviewer` object. + + +#### **Signal Viewer** (`sigviewer`) +Optimized for 1-dimensional signal visualization and manipulation. See the dedicated [tutorial](https://github.com/Biomedical-Imaging-Group/interactive-kit/tree/master/tutorials/SignalViewer_Tutorial.ipynb) and [wiki](https://github.com/Biomedical-Imaging-Group/interactive-kit/wiki/Signal-Viewer). + +<!-- ### **Decision Boundary Viewer** (`boundviewer`) --> +## Installation and usage +First, make sure you have installed Python 3.6 or higher. Then, `interactive-kit` can easily be installed through PyPI: + +``` +pip install interactive-kit==0.1rc3 +``` + +To use in a jupyter notebook, you can import the modules in the following way: + +```python +from interactive_kit import imviewer, sigviewer +``` + +## Team +The viewer was developed at the [EPFL's Biomedical Imaging Group](https://bigwww.epfl.ch/), mainly by + +* Alejandro Noguerón Aramburu (alejandro.nogueronaramburu@epfl.ch, [Alejandro-1996](https://github.com/Alejandro-1996)) + +with contributions from + +* Kay Lächler (kay.lachler@epfl.ch, [TheUser0571](https://github.com/TheUser0571)) +* [Pol del Aguila Pla](https://poldap.github.io), (pol.delaguilapla@epfl.ch, [poldap](https://github.com/poldap)) +* [Daniel Sage ](http://bigwww.epfl.ch/sage/index.html), (daniel.sage@epfl.ch, [dasv74](https://github.com/dasv74)) + +The development of the viewer was supported by the [Digital Resources for Instruction and Learning (DRIL) Fund](https://www.epfl.ch/education/educational-initiatives/cede/digitaltools/dril/) at EPFL, which supported the projects _IPLAB – Image Processing Laboratories on Noto_ and _FeedbackNow – Automatic grading and formative feedback for image processing laboratories_ by Pol del Aguila Pla and Daniel Sage in the sprint and fall semesters of 2020, respectively. See the video below for more information. + +[](http://www.youtube.com/watch?v=AF18wN37B6Q "Image Processing Labs with Jupyter") + +### Members of the EPFL community + +If you want to start using `interactive-kit` rightaway, without going through the process of installing Python and Jupyter, you can [click here](https://noto.epfl.ch/hub/user-redirect/git-pull?repo=https%3A%2F%2Fgithub.com%2FBiomedical-Imaging-Group%2FIPLabImageViewer&urlpath=tree%2FIPLabImageViewer%2FIPLabViewer_Tutorial.ipynb&branch=master) and start using right away from [Noto](https://www.epfl.ch/education/educational-initiatives/cede/digitaltools/noto/), EPFL's Jupyter centralized platform. + +## Contributions + +We appreciate contributions, feedback and bug reports from the community: +* If you encounter any bug, please open an issue and describe. We will try to fix it or give you a workaround as soon as possible. +* If you wish to contribute, fork the repository and then open a pull request. + + + + +%package help +Summary: Development documents and examples for interactive-kit +Provides: python3-interactive-kit-doc +%description help +# `interactive-kit` + +A toolkit for interactive visualization of signal and image processing on [Jupyter](https://jupyter.org/) Notebooks. + + + +`interactive-kit` was created to simplify visualization in image and signal processing teaching, learning and research. Using [Jupyter](https://jupyter.org/) Notebooks in combination with `interactive-kit` a user with virtually no programming experience, or without any experience with `matplotlib`, will be able to display and manipulate one or several signals or images and interactively explore them. It is even possible to extract information and perform operations directly on the signal or image without the need to re-run the cell or to plot again. + +The class is designed to run in Jupyter Notebooks or Jupyter Lab, using `matplotlib`'s dynamic widget-based environment ([`ipympl`](https://github.com/matplotlib/ipympl)), which needs to be activated with the magic command `%matplotlib widget`. All the functionalities are controlled either through `matplotlib`'s native widgets (zoom, pan, and change of figure size) or through additional `ipywidgets`-based buttons and sliders. + +## Modules + +#### **Image Viewer** (`imviewer`) + +Optimized for image visualization and manipulation. See the dedicated [tutorial](https://github.com/Biomedical-Imaging-Group/interactive-kit/tree/master/tutorials/ImageViewer_Tutorial.ipynb) and [wiki](https://github.com/Biomedical-Imaging-Group/interactive-kit/wiki/Image-Viewer). + +##### Main features +Once called, from the `imviewer` and using both widgets and programmatic commands, a user will be able to: + +* Plot several images at the same time, and choose different display options (one image at a time, or a customized grid of images), +* Change the brightness and contrast of the images through a slider, +* Explore the histogram of the image, +* Choose different colormaps and visualization options (colorbar, axis), +* Get 1st and 2nd order statistics -updated automatically when zooming into a region- of the image, +* Calculate and visualize differences between two different images, +* Declare functions that perform operations on an image, and through custom widgets, see the effect of the function with different parameters applied on different images, directly inside the `imviewer` object. + + +#### **Signal Viewer** (`sigviewer`) +Optimized for 1-dimensional signal visualization and manipulation. See the dedicated [tutorial](https://github.com/Biomedical-Imaging-Group/interactive-kit/tree/master/tutorials/SignalViewer_Tutorial.ipynb) and [wiki](https://github.com/Biomedical-Imaging-Group/interactive-kit/wiki/Signal-Viewer). + +<!-- ### **Decision Boundary Viewer** (`boundviewer`) --> +## Installation and usage +First, make sure you have installed Python 3.6 or higher. Then, `interactive-kit` can easily be installed through PyPI: + +``` +pip install interactive-kit==0.1rc3 +``` + +To use in a jupyter notebook, you can import the modules in the following way: + +```python +from interactive_kit import imviewer, sigviewer +``` + +## Team +The viewer was developed at the [EPFL's Biomedical Imaging Group](https://bigwww.epfl.ch/), mainly by + +* Alejandro Noguerón Aramburu (alejandro.nogueronaramburu@epfl.ch, [Alejandro-1996](https://github.com/Alejandro-1996)) + +with contributions from + +* Kay Lächler (kay.lachler@epfl.ch, [TheUser0571](https://github.com/TheUser0571)) +* [Pol del Aguila Pla](https://poldap.github.io), (pol.delaguilapla@epfl.ch, [poldap](https://github.com/poldap)) +* [Daniel Sage ](http://bigwww.epfl.ch/sage/index.html), (daniel.sage@epfl.ch, [dasv74](https://github.com/dasv74)) + +The development of the viewer was supported by the [Digital Resources for Instruction and Learning (DRIL) Fund](https://www.epfl.ch/education/educational-initiatives/cede/digitaltools/dril/) at EPFL, which supported the projects _IPLAB – Image Processing Laboratories on Noto_ and _FeedbackNow – Automatic grading and formative feedback for image processing laboratories_ by Pol del Aguila Pla and Daniel Sage in the sprint and fall semesters of 2020, respectively. See the video below for more information. + +[](http://www.youtube.com/watch?v=AF18wN37B6Q "Image Processing Labs with Jupyter") + +### Members of the EPFL community + +If you want to start using `interactive-kit` rightaway, without going through the process of installing Python and Jupyter, you can [click here](https://noto.epfl.ch/hub/user-redirect/git-pull?repo=https%3A%2F%2Fgithub.com%2FBiomedical-Imaging-Group%2FIPLabImageViewer&urlpath=tree%2FIPLabImageViewer%2FIPLabViewer_Tutorial.ipynb&branch=master) and start using right away from [Noto](https://www.epfl.ch/education/educational-initiatives/cede/digitaltools/noto/), EPFL's Jupyter centralized platform. + +## Contributions + +We appreciate contributions, feedback and bug reports from the community: +* If you encounter any bug, please open an issue and describe. We will try to fix it or give you a workaround as soon as possible. +* If you wish to contribute, fork the repository and then open a pull request. + + + + +%prep +%autosetup -n interactive-kit-0.1.6 + +%build +%py3_build + +%install +%py3_install +install -d -m755 %{buildroot}/%{_pkgdocdir} +if [ -d doc ]; then cp -arf doc %{buildroot}/%{_pkgdocdir}; fi +if [ -d docs ]; then cp -arf docs %{buildroot}/%{_pkgdocdir}; fi +if [ -d example ]; then cp -arf example %{buildroot}/%{_pkgdocdir}; fi +if [ -d examples ]; then cp -arf examples %{buildroot}/%{_pkgdocdir}; fi +pushd %{buildroot} +if [ -d usr/lib ]; then + find usr/lib -type f -printf "\"/%h/%f\"\n" >> filelist.lst +fi +if [ -d usr/lib64 ]; then + find usr/lib64 -type f -printf "\"/%h/%f\"\n" >> filelist.lst +fi +if [ -d usr/bin ]; then + find usr/bin -type f -printf "\"/%h/%f\"\n" >> filelist.lst +fi +if [ -d usr/sbin ]; then + find usr/sbin -type f -printf "\"/%h/%f\"\n" >> filelist.lst +fi +touch doclist.lst +if [ -d usr/share/man ]; then + find usr/share/man -type f -printf "\"/%h/%f.gz\"\n" >> doclist.lst +fi +popd +mv %{buildroot}/filelist.lst . +mv %{buildroot}/doclist.lst . + +%files -n python3-interactive-kit -f filelist.lst +%dir %{python3_sitelib}/* + +%files help -f doclist.lst +%{_docdir}/* + +%changelog +* Tue Jun 20 2023 Python_Bot <Python_Bot@openeuler.org> - 0.1.6-1 +- Package Spec generated @@ -0,0 +1 @@ +a095de9984ac7b999023a18d7d49a9d7 interactive-kit-0.1.6.tar.gz |