
diff options
Diffstat (limited to 'python-matplotlib-label-lines.spec')
| -rw-r--r-- | python-matplotlib-label-lines.spec | 340 |
1 files changed, 340 insertions, 0 deletions
diff --git a/python-matplotlib-label-lines.spec b/python-matplotlib-label-lines.spec new file mode 100644 index 0000000..680c496 --- /dev/null +++ b/python-matplotlib-label-lines.spec @@ -0,0 +1,340 @@ +%global _empty_manifest_terminate_build 0 +Name: python-matplotlib-label-lines +Version: 0.5.1 +Release: 1 +Summary: Label lines in matplotlib. +License: MIT +URL: https://github.com/cphyc/matplotlib-label-lines +Source0: https://mirrors.nju.edu.cn/pypi/web/packages/b9/4f/b97524a9d62e25db791c43ad637bcb928a4a08f267191064caa2b959e261/matplotlib_label_lines-0.5.1.tar.gz +BuildArch: noarch + +Requires: python3-matplotlib +Requires: python3-more-itertools +Requires: python3-numpy +Requires: python3-flake8 +Requires: python3-flake8-black +Requires: python3-flake8-bugbear +Requires: python3-matplotlib +Requires: python3-pytest +Requires: python3-pytest-cov +Requires: python3-pytest-mpl + +%description +# matplotlib-label-lines +[](https://github.com/cphyc/matplotlib-label-lines/actions/workflows/pytest.yml) +[](https://pypi.org/project/matplotlib-label-lines/) +[](https://pypi.org/project/matplotlib-label-lines) +[](https://codecov.io/gh/cphyc/matplotlib-label-lines) + +Easily label line(s) using matplotlib. + +The code is heavily based on http://stackoverflow.com/questions/16992038/inline-labels-in-matplotlib (original code from NauticalMile). + +## Install + +Just do: +```bash +pip install matplotlib-label-lines +``` +You can try it online on binder [](https://mybinder.org/v2/gh/cphyc/matplotlib-label-lines/master), get some inspiration from [the example](https://github.com/cphyc/matplotlib-label-lines/blob/master/example/matplotlib_label_lines.ipynb) or from the following script: +```python +import numpy as np +from matplotlib import pyplot as plt +from scipy.stats import chi2, loglaplace + +from labellines import labelLine, labelLines + +X = np.linspace(0, 1, 500) +A = [1, 2, 5, 10, 20] +funcs = [np.arctan, np.sin, loglaplace(4).pdf, chi2(5).pdf] + +fig, axes = plt.subplots(ncols=2, nrows=3, constrained_layout=True, figsize=(8, 8)) + +axes = axes.flatten() + +ax = axes[0] +for a in A: + ax.plot(X, np.arctan(a * X), label=str(a)) + +labelLines(ax.get_lines(), zorder=2.5) + +ax = axes[1] +for a in A: + ax.plot(X, np.sin(a * X), label=str(a)) + +labelLines(ax.get_lines(), align=False, fontsize=14) + +ax = axes[2] +for a in A: + ax.plot(X, loglaplace(4).pdf(a * X), label=str(a)) + +xvals = [0.8, 0.55, 0.22, 0.104, 0.045] +labelLines(ax.get_lines(), align=False, xvals=xvals, color="k") + +ax = axes[3] +for a in A: + ax.plot(X, chi2(5).pdf(a * X), label=str(a)) + +lines = ax.get_lines() +l1 = lines[-1] +labelLine( + l1, + 0.6, + label=r"$Re=${}".format(l1.get_label()), + ha="left", + va="bottom", + align=False, + backgroundcolor="none", +) +labelLines(lines[:-1], yoffsets=0.01, align=False, backgroundcolor="none") + +# labelLines also supports log-scaled x-axes +ax = axes[4] +for a in A: + ax.semilogx(X, np.arctan(5 * a * X), label=str(a)) + +labelLines(ax.get_lines(), zorder=2.5) + +ax = axes[5] +for a in A: + ax.semilogx(X, chi2(5).pdf(a * X), label=str(a)) + +labelLines(ax.get_lines(), xvals=(0.1, 1), zorder=2.5) + +fig.show() +``` +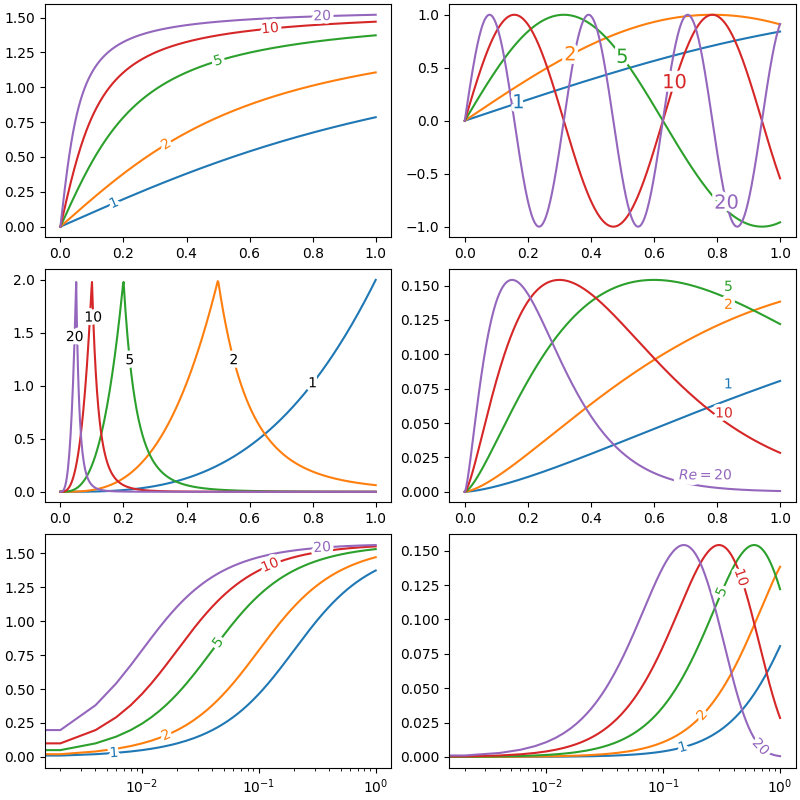 + + + + +%package -n python3-matplotlib-label-lines +Summary: Label lines in matplotlib. +Provides: python-matplotlib-label-lines +BuildRequires: python3-devel +BuildRequires: python3-setuptools +BuildRequires: python3-pip +%description -n python3-matplotlib-label-lines +# matplotlib-label-lines +[](https://github.com/cphyc/matplotlib-label-lines/actions/workflows/pytest.yml) +[](https://pypi.org/project/matplotlib-label-lines/) +[](https://pypi.org/project/matplotlib-label-lines) +[](https://codecov.io/gh/cphyc/matplotlib-label-lines) + +Easily label line(s) using matplotlib. + +The code is heavily based on http://stackoverflow.com/questions/16992038/inline-labels-in-matplotlib (original code from NauticalMile). + +## Install + +Just do: +```bash +pip install matplotlib-label-lines +``` +You can try it online on binder [](https://mybinder.org/v2/gh/cphyc/matplotlib-label-lines/master), get some inspiration from [the example](https://github.com/cphyc/matplotlib-label-lines/blob/master/example/matplotlib_label_lines.ipynb) or from the following script: +```python +import numpy as np +from matplotlib import pyplot as plt +from scipy.stats import chi2, loglaplace + +from labellines import labelLine, labelLines + +X = np.linspace(0, 1, 500) +A = [1, 2, 5, 10, 20] +funcs = [np.arctan, np.sin, loglaplace(4).pdf, chi2(5).pdf] + +fig, axes = plt.subplots(ncols=2, nrows=3, constrained_layout=True, figsize=(8, 8)) + +axes = axes.flatten() + +ax = axes[0] +for a in A: + ax.plot(X, np.arctan(a * X), label=str(a)) + +labelLines(ax.get_lines(), zorder=2.5) + +ax = axes[1] +for a in A: + ax.plot(X, np.sin(a * X), label=str(a)) + +labelLines(ax.get_lines(), align=False, fontsize=14) + +ax = axes[2] +for a in A: + ax.plot(X, loglaplace(4).pdf(a * X), label=str(a)) + +xvals = [0.8, 0.55, 0.22, 0.104, 0.045] +labelLines(ax.get_lines(), align=False, xvals=xvals, color="k") + +ax = axes[3] +for a in A: + ax.plot(X, chi2(5).pdf(a * X), label=str(a)) + +lines = ax.get_lines() +l1 = lines[-1] +labelLine( + l1, + 0.6, + label=r"$Re=${}".format(l1.get_label()), + ha="left", + va="bottom", + align=False, + backgroundcolor="none", +) +labelLines(lines[:-1], yoffsets=0.01, align=False, backgroundcolor="none") + +# labelLines also supports log-scaled x-axes +ax = axes[4] +for a in A: + ax.semilogx(X, np.arctan(5 * a * X), label=str(a)) + +labelLines(ax.get_lines(), zorder=2.5) + +ax = axes[5] +for a in A: + ax.semilogx(X, chi2(5).pdf(a * X), label=str(a)) + +labelLines(ax.get_lines(), xvals=(0.1, 1), zorder=2.5) + +fig.show() +``` + + + + + +%package help +Summary: Development documents and examples for matplotlib-label-lines +Provides: python3-matplotlib-label-lines-doc +%description help +# matplotlib-label-lines +[](https://github.com/cphyc/matplotlib-label-lines/actions/workflows/pytest.yml) +[](https://pypi.org/project/matplotlib-label-lines/) +[](https://pypi.org/project/matplotlib-label-lines) +[](https://codecov.io/gh/cphyc/matplotlib-label-lines) + +Easily label line(s) using matplotlib. + +The code is heavily based on http://stackoverflow.com/questions/16992038/inline-labels-in-matplotlib (original code from NauticalMile). + +## Install + +Just do: +```bash +pip install matplotlib-label-lines +``` +You can try it online on binder [](https://mybinder.org/v2/gh/cphyc/matplotlib-label-lines/master), get some inspiration from [the example](https://github.com/cphyc/matplotlib-label-lines/blob/master/example/matplotlib_label_lines.ipynb) or from the following script: +```python +import numpy as np +from matplotlib import pyplot as plt +from scipy.stats import chi2, loglaplace + +from labellines import labelLine, labelLines + +X = np.linspace(0, 1, 500) +A = [1, 2, 5, 10, 20] +funcs = [np.arctan, np.sin, loglaplace(4).pdf, chi2(5).pdf] + +fig, axes = plt.subplots(ncols=2, nrows=3, constrained_layout=True, figsize=(8, 8)) + +axes = axes.flatten() + +ax = axes[0] +for a in A: + ax.plot(X, np.arctan(a * X), label=str(a)) + +labelLines(ax.get_lines(), zorder=2.5) + +ax = axes[1] +for a in A: + ax.plot(X, np.sin(a * X), label=str(a)) + +labelLines(ax.get_lines(), align=False, fontsize=14) + +ax = axes[2] +for a in A: + ax.plot(X, loglaplace(4).pdf(a * X), label=str(a)) + +xvals = [0.8, 0.55, 0.22, 0.104, 0.045] +labelLines(ax.get_lines(), align=False, xvals=xvals, color="k") + +ax = axes[3] +for a in A: + ax.plot(X, chi2(5).pdf(a * X), label=str(a)) + +lines = ax.get_lines() +l1 = lines[-1] +labelLine( + l1, + 0.6, + label=r"$Re=${}".format(l1.get_label()), + ha="left", + va="bottom", + align=False, + backgroundcolor="none", +) +labelLines(lines[:-1], yoffsets=0.01, align=False, backgroundcolor="none") + +# labelLines also supports log-scaled x-axes +ax = axes[4] +for a in A: + ax.semilogx(X, np.arctan(5 * a * X), label=str(a)) + +labelLines(ax.get_lines(), zorder=2.5) + +ax = axes[5] +for a in A: + ax.semilogx(X, chi2(5).pdf(a * X), label=str(a)) + +labelLines(ax.get_lines(), xvals=(0.1, 1), zorder=2.5) + +fig.show() +``` + + + + + +%prep +%autosetup -n matplotlib-label-lines-0.5.1 + +%build +%py3_build + +%install +%py3_install +install -d -m755 %{buildroot}/%{_pkgdocdir} +if [ -d doc ]; then cp -arf doc %{buildroot}/%{_pkgdocdir}; fi +if [ -d docs ]; then cp -arf docs %{buildroot}/%{_pkgdocdir}; fi +if [ -d example ]; then cp -arf example %{buildroot}/%{_pkgdocdir}; fi +if [ -d examples ]; then cp -arf examples %{buildroot}/%{_pkgdocdir}; fi +pushd %{buildroot} +if [ -d usr/lib ]; then + find usr/lib -type f -printf "/%h/%f\n" >> filelist.lst +fi +if [ -d usr/lib64 ]; then + find usr/lib64 -type f -printf "/%h/%f\n" >> filelist.lst +fi +if [ -d usr/bin ]; then + find usr/bin -type f -printf "/%h/%f\n" >> filelist.lst +fi +if [ -d usr/sbin ]; then + find usr/sbin -type f -printf "/%h/%f\n" >> filelist.lst +fi +touch doclist.lst +if [ -d usr/share/man ]; then + find usr/share/man -type f -printf "/%h/%f.gz\n" >> doclist.lst +fi +popd +mv %{buildroot}/filelist.lst . +mv %{buildroot}/doclist.lst . + +%files -n python3-matplotlib-label-lines -f filelist.lst +%dir %{python3_sitelib}/* + +%files help -f doclist.lst +%{_docdir}/* + +%changelog +* Mon Apr 10 2023 Python_Bot <Python_Bot@openeuler.org> - 0.5.1-1 +- Package Spec generated |