
diff options
| -rw-r--r-- | .gitignore | 1 | ||||
| -rw-r--r-- | python-termplotlib.spec | 472 | ||||
| -rw-r--r-- | sources | 1 |
3 files changed, 474 insertions, 0 deletions
@@ -0,0 +1 @@ +/termplotlib-0.3.9.tar.gz diff --git a/python-termplotlib.spec b/python-termplotlib.spec new file mode 100644 index 0000000..0b0967a --- /dev/null +++ b/python-termplotlib.spec @@ -0,0 +1,472 @@ +%global _empty_manifest_terminate_build 0 +Name: python-termplotlib +Version: 0.3.9 +Release: 1 +Summary: Python plotting for the command line +License: GPL-3.0-or-later +URL: https://github.com/nschloe/termplotlib +Source0: https://mirrors.nju.edu.cn/pypi/web/packages/b4/60/8a74d2503dd64975402c7b8d00f6e201e8cbba5348282433fa5fb8d41b67/termplotlib-0.3.9.tar.gz +BuildArch: noarch + +Requires: python3-numpy + +%description +# termplotlib + +[](https://pypi.org/project/termplotlib) +[](https://pypi.org/pypi/termplotlib/) +[](https://github.com/nschloe/termplotlib) +[](https://pypistats.org/packages/termplotlib) + +[](https://github.com/nschloe/termplotlib/actions?query=workflow%3Aci) +[](https://codecov.io/gh/nschloe/termplotlib) +[](https://lgtm.com/projects/g/nschloe/termplotlib) +[](https://github.com/psf/black) + +termplotlib is a Python library for all your terminal plotting needs. It aims to work +like [matplotlib](https://matplotlib.org/). + + +### Line plots + +For line plots, termplotlib relies on [gnuplot](http://www.gnuplot.info/). +With that installed, the code +```python +import termplotlib as tpl +import numpy as np + +x = np.linspace(0, 2 * np.pi, 10) +y = np.sin(x) + +fig = tpl.figure() +fig.plot(x, y, label="data", width=50, height=15) +fig.show() +``` +produces +<!--pytest-codeblocks:expected-output--> +``` + 1 +---------------------------------------+ + 0.8 | ** ** | + 0.6 | * ** data ******* | + 0.4 | ** | + 0.2 |* ** | + 0 | ** | + | * | + -0.2 | ** ** | + -0.4 | ** * | + -0.6 | ** | + -0.8 | **** ** | + -1 +---------------------------------------+ + 0 1 2 3 4 5 6 7 +``` + +### Horizontal histograms + +```python +import termplotlib as tpl +import numpy as np + +rng = np.random.default_rng(123) +sample = rng.standard_normal(size=1000) +counts, bin_edges = np.histogram(sample) + +fig = tpl.figure() +fig.hist(counts, bin_edges, orientation="horizontal", force_ascii=False) +fig.show() +``` +produces + +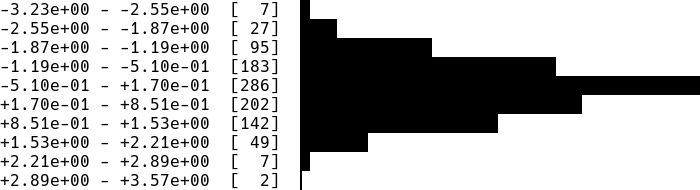 + +Horizontal bar charts are covered as well. This +```python +import termplotlib as tpl + +fig = tpl.figure() +fig.barh([3, 10, 5, 2], ["Cats", "Dogs", "Cows", "Geese"], force_ascii=True) +fig.show() +``` +produces +<!--pytest-codeblocks:expected-output--> +``` +Cats [ 3] ************ +Dogs [10] **************************************** +Cows [ 5] ******************** +Geese [ 2] ******** +``` + +### Vertical histograms + +```python +import termplotlib as tpl +import numpy as np + +rng = np.random.default_rng(123) +sample = rng.standard_normal(size=1000) +counts, bin_edges = np.histogram(sample, bins=40) +fig = tpl.figure() +fig.hist(counts, bin_edges, grid=[15, 25], force_ascii=False) +fig.show() +``` +produces + + + + +### Tables + +Support for tables has moved over to +[termtables](https://github.com/nschloe/termtables). + + +### Installation + +termplotlib is [available from the Python Package +Index](https://pypi.org/project/termplotlib/), so simply do +``` +pip install termplotlib +``` +to install. + + +### Testing + +To run the termplotlib unit tests, check out this repository and type +``` +pytest +``` + +### Similar projects + + * [asciichart](https://github.com/kroitor/asciichart) + * [bashplotlib](https://github.com/glamp/bashplotlib) + * [plotext](https://github.com/piccolomo/plotext) + * [plotille](https://github.com/tammoippen/plotille) + + + + +%package -n python3-termplotlib +Summary: Python plotting for the command line +Provides: python-termplotlib +BuildRequires: python3-devel +BuildRequires: python3-setuptools +BuildRequires: python3-pip +%description -n python3-termplotlib +# termplotlib + +[](https://pypi.org/project/termplotlib) +[](https://pypi.org/pypi/termplotlib/) +[](https://github.com/nschloe/termplotlib) +[](https://pypistats.org/packages/termplotlib) + +[](https://github.com/nschloe/termplotlib/actions?query=workflow%3Aci) +[](https://codecov.io/gh/nschloe/termplotlib) +[](https://lgtm.com/projects/g/nschloe/termplotlib) +[](https://github.com/psf/black) + +termplotlib is a Python library for all your terminal plotting needs. It aims to work +like [matplotlib](https://matplotlib.org/). + + +### Line plots + +For line plots, termplotlib relies on [gnuplot](http://www.gnuplot.info/). +With that installed, the code +```python +import termplotlib as tpl +import numpy as np + +x = np.linspace(0, 2 * np.pi, 10) +y = np.sin(x) + +fig = tpl.figure() +fig.plot(x, y, label="data", width=50, height=15) +fig.show() +``` +produces +<!--pytest-codeblocks:expected-output--> +``` + 1 +---------------------------------------+ + 0.8 | ** ** | + 0.6 | * ** data ******* | + 0.4 | ** | + 0.2 |* ** | + 0 | ** | + | * | + -0.2 | ** ** | + -0.4 | ** * | + -0.6 | ** | + -0.8 | **** ** | + -1 +---------------------------------------+ + 0 1 2 3 4 5 6 7 +``` + +### Horizontal histograms + +```python +import termplotlib as tpl +import numpy as np + +rng = np.random.default_rng(123) +sample = rng.standard_normal(size=1000) +counts, bin_edges = np.histogram(sample) + +fig = tpl.figure() +fig.hist(counts, bin_edges, orientation="horizontal", force_ascii=False) +fig.show() +``` +produces + + + +Horizontal bar charts are covered as well. This +```python +import termplotlib as tpl + +fig = tpl.figure() +fig.barh([3, 10, 5, 2], ["Cats", "Dogs", "Cows", "Geese"], force_ascii=True) +fig.show() +``` +produces +<!--pytest-codeblocks:expected-output--> +``` +Cats [ 3] ************ +Dogs [10] **************************************** +Cows [ 5] ******************** +Geese [ 2] ******** +``` + +### Vertical histograms + +```python +import termplotlib as tpl +import numpy as np + +rng = np.random.default_rng(123) +sample = rng.standard_normal(size=1000) +counts, bin_edges = np.histogram(sample, bins=40) +fig = tpl.figure() +fig.hist(counts, bin_edges, grid=[15, 25], force_ascii=False) +fig.show() +``` +produces + + + + +### Tables + +Support for tables has moved over to +[termtables](https://github.com/nschloe/termtables). + + +### Installation + +termplotlib is [available from the Python Package +Index](https://pypi.org/project/termplotlib/), so simply do +``` +pip install termplotlib +``` +to install. + + +### Testing + +To run the termplotlib unit tests, check out this repository and type +``` +pytest +``` + +### Similar projects + + * [asciichart](https://github.com/kroitor/asciichart) + * [bashplotlib](https://github.com/glamp/bashplotlib) + * [plotext](https://github.com/piccolomo/plotext) + * [plotille](https://github.com/tammoippen/plotille) + + + + +%package help +Summary: Development documents and examples for termplotlib +Provides: python3-termplotlib-doc +%description help +# termplotlib + +[](https://pypi.org/project/termplotlib) +[](https://pypi.org/pypi/termplotlib/) +[](https://github.com/nschloe/termplotlib) +[](https://pypistats.org/packages/termplotlib) + +[](https://github.com/nschloe/termplotlib/actions?query=workflow%3Aci) +[](https://codecov.io/gh/nschloe/termplotlib) +[](https://lgtm.com/projects/g/nschloe/termplotlib) +[](https://github.com/psf/black) + +termplotlib is a Python library for all your terminal plotting needs. It aims to work +like [matplotlib](https://matplotlib.org/). + + +### Line plots + +For line plots, termplotlib relies on [gnuplot](http://www.gnuplot.info/). +With that installed, the code +```python +import termplotlib as tpl +import numpy as np + +x = np.linspace(0, 2 * np.pi, 10) +y = np.sin(x) + +fig = tpl.figure() +fig.plot(x, y, label="data", width=50, height=15) +fig.show() +``` +produces +<!--pytest-codeblocks:expected-output--> +``` + 1 +---------------------------------------+ + 0.8 | ** ** | + 0.6 | * ** data ******* | + 0.4 | ** | + 0.2 |* ** | + 0 | ** | + | * | + -0.2 | ** ** | + -0.4 | ** * | + -0.6 | ** | + -0.8 | **** ** | + -1 +---------------------------------------+ + 0 1 2 3 4 5 6 7 +``` + +### Horizontal histograms + +```python +import termplotlib as tpl +import numpy as np + +rng = np.random.default_rng(123) +sample = rng.standard_normal(size=1000) +counts, bin_edges = np.histogram(sample) + +fig = tpl.figure() +fig.hist(counts, bin_edges, orientation="horizontal", force_ascii=False) +fig.show() +``` +produces + + + +Horizontal bar charts are covered as well. This +```python +import termplotlib as tpl + +fig = tpl.figure() +fig.barh([3, 10, 5, 2], ["Cats", "Dogs", "Cows", "Geese"], force_ascii=True) +fig.show() +``` +produces +<!--pytest-codeblocks:expected-output--> +``` +Cats [ 3] ************ +Dogs [10] **************************************** +Cows [ 5] ******************** +Geese [ 2] ******** +``` + +### Vertical histograms + +```python +import termplotlib as tpl +import numpy as np + +rng = np.random.default_rng(123) +sample = rng.standard_normal(size=1000) +counts, bin_edges = np.histogram(sample, bins=40) +fig = tpl.figure() +fig.hist(counts, bin_edges, grid=[15, 25], force_ascii=False) +fig.show() +``` +produces + + + + +### Tables + +Support for tables has moved over to +[termtables](https://github.com/nschloe/termtables). + + +### Installation + +termplotlib is [available from the Python Package +Index](https://pypi.org/project/termplotlib/), so simply do +``` +pip install termplotlib +``` +to install. + + +### Testing + +To run the termplotlib unit tests, check out this repository and type +``` +pytest +``` + +### Similar projects + + * [asciichart](https://github.com/kroitor/asciichart) + * [bashplotlib](https://github.com/glamp/bashplotlib) + * [plotext](https://github.com/piccolomo/plotext) + * [plotille](https://github.com/tammoippen/plotille) + + + + +%prep +%autosetup -n termplotlib-0.3.9 + +%build +%py3_build + +%install +%py3_install +install -d -m755 %{buildroot}/%{_pkgdocdir} +if [ -d doc ]; then cp -arf doc %{buildroot}/%{_pkgdocdir}; fi +if [ -d docs ]; then cp -arf docs %{buildroot}/%{_pkgdocdir}; fi +if [ -d example ]; then cp -arf example %{buildroot}/%{_pkgdocdir}; fi +if [ -d examples ]; then cp -arf examples %{buildroot}/%{_pkgdocdir}; fi +pushd %{buildroot} +if [ -d usr/lib ]; then + find usr/lib -type f -printf "/%h/%f\n" >> filelist.lst +fi +if [ -d usr/lib64 ]; then + find usr/lib64 -type f -printf "/%h/%f\n" >> filelist.lst +fi +if [ -d usr/bin ]; then + find usr/bin -type f -printf "/%h/%f\n" >> filelist.lst +fi +if [ -d usr/sbin ]; then + find usr/sbin -type f -printf "/%h/%f\n" >> filelist.lst +fi +touch doclist.lst +if [ -d usr/share/man ]; then + find usr/share/man -type f -printf "/%h/%f.gz\n" >> doclist.lst +fi +popd +mv %{buildroot}/filelist.lst . +mv %{buildroot}/doclist.lst . + +%files -n python3-termplotlib -f filelist.lst +%dir %{python3_sitelib}/* + +%files help -f doclist.lst +%{_docdir}/* + +%changelog +* Wed Apr 12 2023 Python_Bot <Python_Bot@openeuler.org> - 0.3.9-1 +- Package Spec generated @@ -0,0 +1 @@ +8f8858a70743582d2af1cc8bcb6c20c8 termplotlib-0.3.9.tar.gz |