%global _empty_manifest_terminate_build 0
Name: python-diagrams
Version: 0.23.3
Release: 1
Summary: Diagram as Code
License: MIT
URL: https://diagrams.mingrammer.com
Source0: https://mirrors.nju.edu.cn/pypi/web/packages/1b/ee/3070e64c5e468d1f3a0a04c2863cff633b2263b33265a82df1f1e8c82a36/diagrams-0.23.3.tar.gz
BuildArch: noarch
Requires: python3-graphviz
Requires: python3-jinja2
Requires: python3-contextvars
Requires: python3-typed-ast
%description

# Diagrams
[](/LICENSE)
[](https://badge.fury.io/py/diagrams)


[](https://www.tickgit.com/browse?repo=github.com/mingrammer/diagrams)

 **Diagram as Code**.
Diagrams lets you draw the cloud system architecture **in Python code**. It was born for **prototyping** a new system architecture design without any design tools. You can also describe or visualize the existing system architecture as well. Diagrams currently supports main major providers including: `AWS`, `Azure`, `GCP`, `Kubernetes`, `Alibaba Cloud`, `Oracle Cloud` etc... It also supports `On-Premise` nodes, `SaaS` and major `Programming` frameworks and languages.
**Diagram as Code** also allows you to **track** the architecture diagram changes in any **version control** system.
> NOTE: It does not control any actual cloud resources nor does it generate cloud formation or terraform code. It is just for drawing the cloud system architecture diagrams.
## Providers


## Getting Started
It requires **Python 3.6** or higher, check your Python version first.
It uses [Graphviz](https://www.graphviz.org/) to render the diagram, so you need to [install Graphviz](https://graphviz.gitlab.io/download/) to use **diagrams**. After installing graphviz (or already have it), install the **diagrams**.
> macOS users can download the Graphviz via `brew install graphviz` if you're using [Homebrew](https://brew.sh).
```shell
# using pip (pip3)
$ pip install diagrams
# using pipenv
$ pipenv install diagrams
# using poetry
$ poetry add diagrams
```
You can start with [quick start](https://diagrams.mingrammer.com/docs/getting-started/installation#quick-start). Check out [guides](https://diagrams.mingrammer.com/docs/guides/diagram) for more details, and you can find all available nodes list in [here](https://diagrams.mingrammer.com/docs/nodes/aws).
## Examples
| Event Processing | Stateful Architecture | Advanced Web Service |
| ------------------------------------------------------------ | ------------------------------------------------------------ | ------------------------------------------------------------ |
| 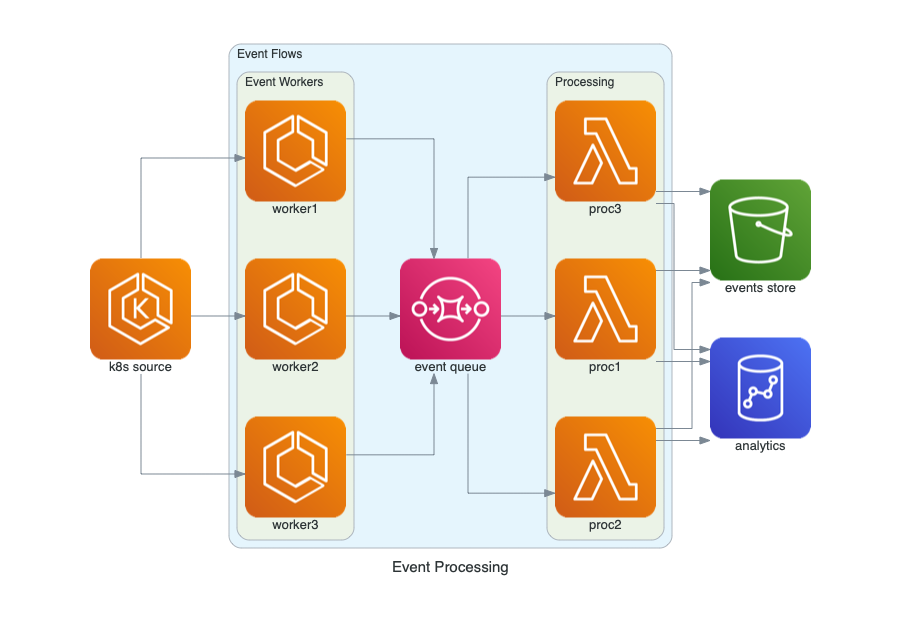 | 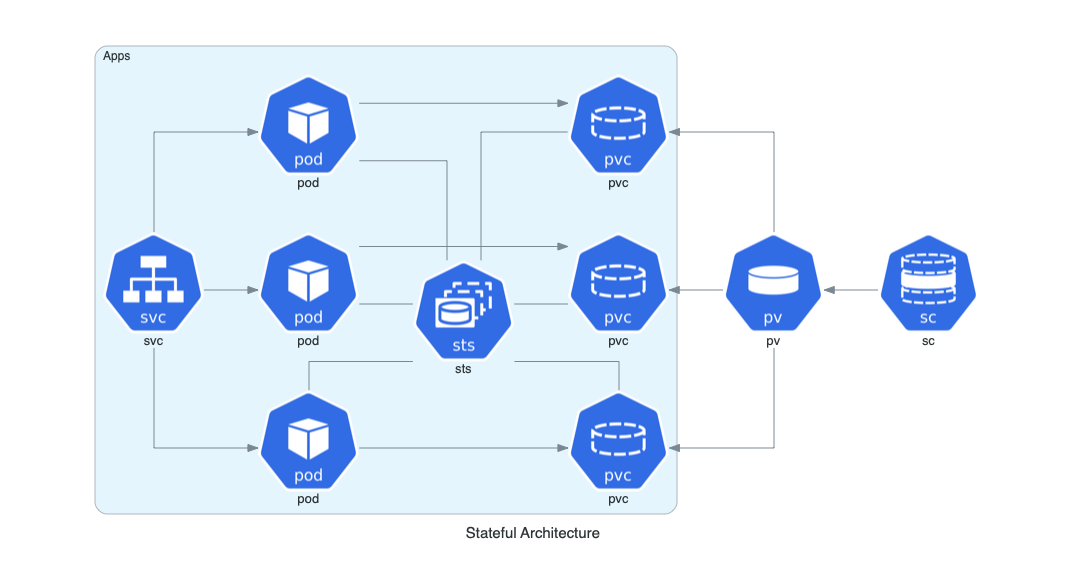 | 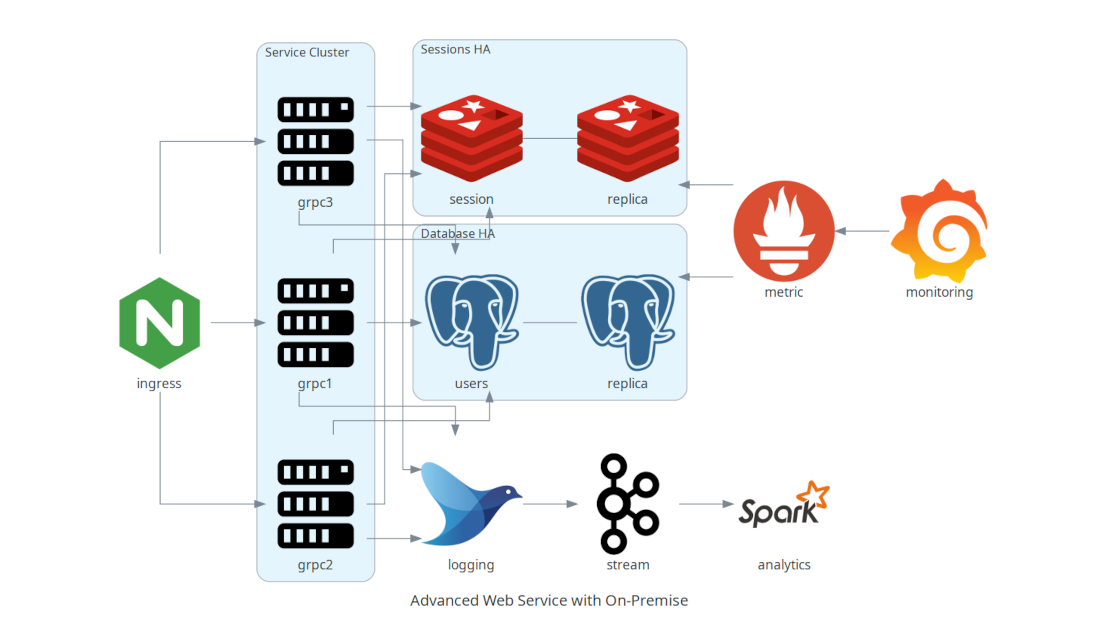 |
You can find all the examples on the [examples](https://diagrams.mingrammer.com/docs/getting-started/examples) page.
## Contributing
To contribute to diagram, check out [contribution guidelines](CONTRIBUTING.md).
> Let me know if you are using diagrams! I'll add you in showcase page. (I'm working on it!) :)
## Who uses it?
[GitPitch](https://gitpitch.github.io/gitpitch) is the perfect slide deck solution for Tech Conferences, Training, Developer Advocates, and Educators. Diagrams is now available as a dedicated [Cloud Diagram Markdown Widget](https://gitpitch.github.io/gitpitch/#/diagrams/cloud-architecture) so you can use Diagrams directly on any slide for conferences, meetups, and training.
[Cloudiscovery](https://github.com/Cloud-Architects/cloudiscovery) helps you to analyze resources in your cloud (AWS/GCP/Azure/Alibaba/IBM) account. It allows you to create a diagram of analyzed cloud resource map based on this Diagrams library, so you can draw your existing cloud infrastructure with Cloudiscovery.
[Airflow Diagrams](https://github.com/feluelle/airflow-diagrams) is an Airflow plugin that aims to easily visualise your Airflow DAGs on service level from providers like AWS, GCP, Azure, etc. via diagrams.
## Other languages
- If you are familiar with Go, you can use [go-diagrams](https://github.com/blushft/go-diagrams) as well.
## License
[MIT](LICENSE)
%package -n python3-diagrams
Summary: Diagram as Code
Provides: python-diagrams
BuildRequires: python3-devel
BuildRequires: python3-setuptools
BuildRequires: python3-pip
%description -n python3-diagrams

# Diagrams
[](/LICENSE)
[](https://badge.fury.io/py/diagrams)


[](https://www.tickgit.com/browse?repo=github.com/mingrammer/diagrams)

**Diagram as Code**.
Diagrams lets you draw the cloud system architecture **in Python code**. It was born for **prototyping** a new system architecture design without any design tools. You can also describe or visualize the existing system architecture as well. Diagrams currently supports main major providers including: `AWS`, `Azure`, `GCP`, `Kubernetes`, `Alibaba Cloud`, `Oracle Cloud` etc... It also supports `On-Premise` nodes, `SaaS` and major `Programming` frameworks and languages.
**Diagram as Code** also allows you to **track** the architecture diagram changes in any **version control** system.
> NOTE: It does not control any actual cloud resources nor does it generate cloud formation or terraform code. It is just for drawing the cloud system architecture diagrams.
## Providers


## Getting Started
It requires **Python 3.6** or higher, check your Python version first.
It uses [Graphviz](https://www.graphviz.org/) to render the diagram, so you need to [install Graphviz](https://graphviz.gitlab.io/download/) to use **diagrams**. After installing graphviz (or already have it), install the **diagrams**.
> macOS users can download the Graphviz via `brew install graphviz` if you're using [Homebrew](https://brew.sh).
```shell
# using pip (pip3)
$ pip install diagrams
# using pipenv
$ pipenv install diagrams
# using poetry
$ poetry add diagrams
```
You can start with [quick start](https://diagrams.mingrammer.com/docs/getting-started/installation#quick-start). Check out [guides](https://diagrams.mingrammer.com/docs/guides/diagram) for more details, and you can find all available nodes list in [here](https://diagrams.mingrammer.com/docs/nodes/aws).
## Examples
| Event Processing | Stateful Architecture | Advanced Web Service |
| ------------------------------------------------------------ | ------------------------------------------------------------ | ------------------------------------------------------------ |
|  |  |  |
You can find all the examples on the [examples](https://diagrams.mingrammer.com/docs/getting-started/examples) page.
## Contributing
To contribute to diagram, check out [contribution guidelines](CONTRIBUTING.md).
> Let me know if you are using diagrams! I'll add you in showcase page. (I'm working on it!) :)
## Who uses it?
[GitPitch](https://gitpitch.github.io/gitpitch) is the perfect slide deck solution for Tech Conferences, Training, Developer Advocates, and Educators. Diagrams is now available as a dedicated [Cloud Diagram Markdown Widget](https://gitpitch.github.io/gitpitch/#/diagrams/cloud-architecture) so you can use Diagrams directly on any slide for conferences, meetups, and training.
[Cloudiscovery](https://github.com/Cloud-Architects/cloudiscovery) helps you to analyze resources in your cloud (AWS/GCP/Azure/Alibaba/IBM) account. It allows you to create a diagram of analyzed cloud resource map based on this Diagrams library, so you can draw your existing cloud infrastructure with Cloudiscovery.
[Airflow Diagrams](https://github.com/feluelle/airflow-diagrams) is an Airflow plugin that aims to easily visualise your Airflow DAGs on service level from providers like AWS, GCP, Azure, etc. via diagrams.
## Other languages
- If you are familiar with Go, you can use [go-diagrams](https://github.com/blushft/go-diagrams) as well.
## License
[MIT](LICENSE)
%package help
Summary: Development documents and examples for diagrams
Provides: python3-diagrams-doc
%description help

# Diagrams
[](/LICENSE)
[](https://badge.fury.io/py/diagrams)


[](https://www.tickgit.com/browse?repo=github.com/mingrammer/diagrams)

**Diagram as Code**.
Diagrams lets you draw the cloud system architecture **in Python code**. It was born for **prototyping** a new system architecture design without any design tools. You can also describe or visualize the existing system architecture as well. Diagrams currently supports main major providers including: `AWS`, `Azure`, `GCP`, `Kubernetes`, `Alibaba Cloud`, `Oracle Cloud` etc... It also supports `On-Premise` nodes, `SaaS` and major `Programming` frameworks and languages.
**Diagram as Code** also allows you to **track** the architecture diagram changes in any **version control** system.
> NOTE: It does not control any actual cloud resources nor does it generate cloud formation or terraform code. It is just for drawing the cloud system architecture diagrams.
## Providers


## Getting Started
It requires **Python 3.6** or higher, check your Python version first.
It uses [Graphviz](https://www.graphviz.org/) to render the diagram, so you need to [install Graphviz](https://graphviz.gitlab.io/download/) to use **diagrams**. After installing graphviz (or already have it), install the **diagrams**.
> macOS users can download the Graphviz via `brew install graphviz` if you're using [Homebrew](https://brew.sh).
```shell
# using pip (pip3)
$ pip install diagrams
# using pipenv
$ pipenv install diagrams
# using poetry
$ poetry add diagrams
```
You can start with [quick start](https://diagrams.mingrammer.com/docs/getting-started/installation#quick-start). Check out [guides](https://diagrams.mingrammer.com/docs/guides/diagram) for more details, and you can find all available nodes list in [here](https://diagrams.mingrammer.com/docs/nodes/aws).
## Examples
| Event Processing | Stateful Architecture | Advanced Web Service |
| ------------------------------------------------------------ | ------------------------------------------------------------ | ------------------------------------------------------------ |
|  |  |  |
You can find all the examples on the [examples](https://diagrams.mingrammer.com/docs/getting-started/examples) page.
## Contributing
To contribute to diagram, check out [contribution guidelines](CONTRIBUTING.md).
> Let me know if you are using diagrams! I'll add you in showcase page. (I'm working on it!) :)
## Who uses it?
[GitPitch](https://gitpitch.github.io/gitpitch) is the perfect slide deck solution for Tech Conferences, Training, Developer Advocates, and Educators. Diagrams is now available as a dedicated [Cloud Diagram Markdown Widget](https://gitpitch.github.io/gitpitch/#/diagrams/cloud-architecture) so you can use Diagrams directly on any slide for conferences, meetups, and training.
[Cloudiscovery](https://github.com/Cloud-Architects/cloudiscovery) helps you to analyze resources in your cloud (AWS/GCP/Azure/Alibaba/IBM) account. It allows you to create a diagram of analyzed cloud resource map based on this Diagrams library, so you can draw your existing cloud infrastructure with Cloudiscovery.
[Airflow Diagrams](https://github.com/feluelle/airflow-diagrams) is an Airflow plugin that aims to easily visualise your Airflow DAGs on service level from providers like AWS, GCP, Azure, etc. via diagrams.
## Other languages
- If you are familiar with Go, you can use [go-diagrams](https://github.com/blushft/go-diagrams) as well.
## License
[MIT](LICENSE)
%prep
%autosetup -n diagrams-0.23.3
%build
%py3_build
%install
%py3_install
install -d -m755 %{buildroot}/%{_pkgdocdir}
if [ -d doc ]; then cp -arf doc %{buildroot}/%{_pkgdocdir}; fi
if [ -d docs ]; then cp -arf docs %{buildroot}/%{_pkgdocdir}; fi
if [ -d example ]; then cp -arf example %{buildroot}/%{_pkgdocdir}; fi
if [ -d examples ]; then cp -arf examples %{buildroot}/%{_pkgdocdir}; fi
pushd %{buildroot}
if [ -d usr/lib ]; then
find usr/lib -type f -printf "/%h/%f\n" >> filelist.lst
fi
if [ -d usr/lib64 ]; then
find usr/lib64 -type f -printf "/%h/%f\n" >> filelist.lst
fi
if [ -d usr/bin ]; then
find usr/bin -type f -printf "/%h/%f\n" >> filelist.lst
fi
if [ -d usr/sbin ]; then
find usr/sbin -type f -printf "/%h/%f\n" >> filelist.lst
fi
touch doclist.lst
if [ -d usr/share/man ]; then
find usr/share/man -type f -printf "/%h/%f.gz\n" >> doclist.lst
fi
popd
mv %{buildroot}/filelist.lst .
mv %{buildroot}/doclist.lst .
%files -n python3-diagrams -f filelist.lst
%dir %{python3_sitelib}/*
%files help -f doclist.lst
%{_docdir}/*
%changelog
* Tue Apr 11 2023 Python_Bot - 0.23.3-1
- Package Spec generated
**Diagram as Code**.
Diagrams lets you draw the cloud system architecture **in Python code**. It was born for **prototyping** a new system architecture design without any design tools. You can also describe or visualize the existing system architecture as well. Diagrams currently supports main major providers including: `AWS`, `Azure`, `GCP`, `Kubernetes`, `Alibaba Cloud`, `Oracle Cloud` etc... It also supports `On-Premise` nodes, `SaaS` and major `Programming` frameworks and languages.
**Diagram as Code** also allows you to **track** the architecture diagram changes in any **version control** system.
> NOTE: It does not control any actual cloud resources nor does it generate cloud formation or terraform code. It is just for drawing the cloud system architecture diagrams.
## Providers


## Getting Started
It requires **Python 3.6** or higher, check your Python version first.
It uses [Graphviz](https://www.graphviz.org/) to render the diagram, so you need to [install Graphviz](https://graphviz.gitlab.io/download/) to use **diagrams**. After installing graphviz (or already have it), install the **diagrams**.
> macOS users can download the Graphviz via `brew install graphviz` if you're using [Homebrew](https://brew.sh).
```shell
# using pip (pip3)
$ pip install diagrams
# using pipenv
$ pipenv install diagrams
# using poetry
$ poetry add diagrams
```
You can start with [quick start](https://diagrams.mingrammer.com/docs/getting-started/installation#quick-start). Check out [guides](https://diagrams.mingrammer.com/docs/guides/diagram) for more details, and you can find all available nodes list in [here](https://diagrams.mingrammer.com/docs/nodes/aws).
## Examples
| Event Processing | Stateful Architecture | Advanced Web Service |
| ------------------------------------------------------------ | ------------------------------------------------------------ | ------------------------------------------------------------ |
|  |  |  |
You can find all the examples on the [examples](https://diagrams.mingrammer.com/docs/getting-started/examples) page.
## Contributing
To contribute to diagram, check out [contribution guidelines](CONTRIBUTING.md).
> Let me know if you are using diagrams! I'll add you in showcase page. (I'm working on it!) :)
## Who uses it?
[GitPitch](https://gitpitch.github.io/gitpitch) is the perfect slide deck solution for Tech Conferences, Training, Developer Advocates, and Educators. Diagrams is now available as a dedicated [Cloud Diagram Markdown Widget](https://gitpitch.github.io/gitpitch/#/diagrams/cloud-architecture) so you can use Diagrams directly on any slide for conferences, meetups, and training.
[Cloudiscovery](https://github.com/Cloud-Architects/cloudiscovery) helps you to analyze resources in your cloud (AWS/GCP/Azure/Alibaba/IBM) account. It allows you to create a diagram of analyzed cloud resource map based on this Diagrams library, so you can draw your existing cloud infrastructure with Cloudiscovery.
[Airflow Diagrams](https://github.com/feluelle/airflow-diagrams) is an Airflow plugin that aims to easily visualise your Airflow DAGs on service level from providers like AWS, GCP, Azure, etc. via diagrams.
## Other languages
- If you are familiar with Go, you can use [go-diagrams](https://github.com/blushft/go-diagrams) as well.
## License
[MIT](LICENSE)
%package -n python3-diagrams
Summary: Diagram as Code
Provides: python-diagrams
BuildRequires: python3-devel
BuildRequires: python3-setuptools
BuildRequires: python3-pip
%description -n python3-diagrams

# Diagrams
[](/LICENSE)
[](https://badge.fury.io/py/diagrams)


[](https://www.tickgit.com/browse?repo=github.com/mingrammer/diagrams)

**Diagram as Code**.
Diagrams lets you draw the cloud system architecture **in Python code**. It was born for **prototyping** a new system architecture design without any design tools. You can also describe or visualize the existing system architecture as well. Diagrams currently supports main major providers including: `AWS`, `Azure`, `GCP`, `Kubernetes`, `Alibaba Cloud`, `Oracle Cloud` etc... It also supports `On-Premise` nodes, `SaaS` and major `Programming` frameworks and languages.
**Diagram as Code** also allows you to **track** the architecture diagram changes in any **version control** system.
> NOTE: It does not control any actual cloud resources nor does it generate cloud formation or terraform code. It is just for drawing the cloud system architecture diagrams.
## Providers


## Getting Started
It requires **Python 3.6** or higher, check your Python version first.
It uses [Graphviz](https://www.graphviz.org/) to render the diagram, so you need to [install Graphviz](https://graphviz.gitlab.io/download/) to use **diagrams**. After installing graphviz (or already have it), install the **diagrams**.
> macOS users can download the Graphviz via `brew install graphviz` if you're using [Homebrew](https://brew.sh).
```shell
# using pip (pip3)
$ pip install diagrams
# using pipenv
$ pipenv install diagrams
# using poetry
$ poetry add diagrams
```
You can start with [quick start](https://diagrams.mingrammer.com/docs/getting-started/installation#quick-start). Check out [guides](https://diagrams.mingrammer.com/docs/guides/diagram) for more details, and you can find all available nodes list in [here](https://diagrams.mingrammer.com/docs/nodes/aws).
## Examples
| Event Processing | Stateful Architecture | Advanced Web Service |
| ------------------------------------------------------------ | ------------------------------------------------------------ | ------------------------------------------------------------ |
|  |  |  |
You can find all the examples on the [examples](https://diagrams.mingrammer.com/docs/getting-started/examples) page.
## Contributing
To contribute to diagram, check out [contribution guidelines](CONTRIBUTING.md).
> Let me know if you are using diagrams! I'll add you in showcase page. (I'm working on it!) :)
## Who uses it?
[GitPitch](https://gitpitch.github.io/gitpitch) is the perfect slide deck solution for Tech Conferences, Training, Developer Advocates, and Educators. Diagrams is now available as a dedicated [Cloud Diagram Markdown Widget](https://gitpitch.github.io/gitpitch/#/diagrams/cloud-architecture) so you can use Diagrams directly on any slide for conferences, meetups, and training.
[Cloudiscovery](https://github.com/Cloud-Architects/cloudiscovery) helps you to analyze resources in your cloud (AWS/GCP/Azure/Alibaba/IBM) account. It allows you to create a diagram of analyzed cloud resource map based on this Diagrams library, so you can draw your existing cloud infrastructure with Cloudiscovery.
[Airflow Diagrams](https://github.com/feluelle/airflow-diagrams) is an Airflow plugin that aims to easily visualise your Airflow DAGs on service level from providers like AWS, GCP, Azure, etc. via diagrams.
## Other languages
- If you are familiar with Go, you can use [go-diagrams](https://github.com/blushft/go-diagrams) as well.
## License
[MIT](LICENSE)
%package help
Summary: Development documents and examples for diagrams
Provides: python3-diagrams-doc
%description help

# Diagrams
[](/LICENSE)
[](https://badge.fury.io/py/diagrams)


[](https://www.tickgit.com/browse?repo=github.com/mingrammer/diagrams)

**Diagram as Code**.
Diagrams lets you draw the cloud system architecture **in Python code**. It was born for **prototyping** a new system architecture design without any design tools. You can also describe or visualize the existing system architecture as well. Diagrams currently supports main major providers including: `AWS`, `Azure`, `GCP`, `Kubernetes`, `Alibaba Cloud`, `Oracle Cloud` etc... It also supports `On-Premise` nodes, `SaaS` and major `Programming` frameworks and languages.
**Diagram as Code** also allows you to **track** the architecture diagram changes in any **version control** system.
> NOTE: It does not control any actual cloud resources nor does it generate cloud formation or terraform code. It is just for drawing the cloud system architecture diagrams.
## Providers


## Getting Started
It requires **Python 3.6** or higher, check your Python version first.
It uses [Graphviz](https://www.graphviz.org/) to render the diagram, so you need to [install Graphviz](https://graphviz.gitlab.io/download/) to use **diagrams**. After installing graphviz (or already have it), install the **diagrams**.
> macOS users can download the Graphviz via `brew install graphviz` if you're using [Homebrew](https://brew.sh).
```shell
# using pip (pip3)
$ pip install diagrams
# using pipenv
$ pipenv install diagrams
# using poetry
$ poetry add diagrams
```
You can start with [quick start](https://diagrams.mingrammer.com/docs/getting-started/installation#quick-start). Check out [guides](https://diagrams.mingrammer.com/docs/guides/diagram) for more details, and you can find all available nodes list in [here](https://diagrams.mingrammer.com/docs/nodes/aws).
## Examples
| Event Processing | Stateful Architecture | Advanced Web Service |
| ------------------------------------------------------------ | ------------------------------------------------------------ | ------------------------------------------------------------ |
|  |  |  |
You can find all the examples on the [examples](https://diagrams.mingrammer.com/docs/getting-started/examples) page.
## Contributing
To contribute to diagram, check out [contribution guidelines](CONTRIBUTING.md).
> Let me know if you are using diagrams! I'll add you in showcase page. (I'm working on it!) :)
## Who uses it?
[GitPitch](https://gitpitch.github.io/gitpitch) is the perfect slide deck solution for Tech Conferences, Training, Developer Advocates, and Educators. Diagrams is now available as a dedicated [Cloud Diagram Markdown Widget](https://gitpitch.github.io/gitpitch/#/diagrams/cloud-architecture) so you can use Diagrams directly on any slide for conferences, meetups, and training.
[Cloudiscovery](https://github.com/Cloud-Architects/cloudiscovery) helps you to analyze resources in your cloud (AWS/GCP/Azure/Alibaba/IBM) account. It allows you to create a diagram of analyzed cloud resource map based on this Diagrams library, so you can draw your existing cloud infrastructure with Cloudiscovery.
[Airflow Diagrams](https://github.com/feluelle/airflow-diagrams) is an Airflow plugin that aims to easily visualise your Airflow DAGs on service level from providers like AWS, GCP, Azure, etc. via diagrams.
## Other languages
- If you are familiar with Go, you can use [go-diagrams](https://github.com/blushft/go-diagrams) as well.
## License
[MIT](LICENSE)
%prep
%autosetup -n diagrams-0.23.3
%build
%py3_build
%install
%py3_install
install -d -m755 %{buildroot}/%{_pkgdocdir}
if [ -d doc ]; then cp -arf doc %{buildroot}/%{_pkgdocdir}; fi
if [ -d docs ]; then cp -arf docs %{buildroot}/%{_pkgdocdir}; fi
if [ -d example ]; then cp -arf example %{buildroot}/%{_pkgdocdir}; fi
if [ -d examples ]; then cp -arf examples %{buildroot}/%{_pkgdocdir}; fi
pushd %{buildroot}
if [ -d usr/lib ]; then
find usr/lib -type f -printf "/%h/%f\n" >> filelist.lst
fi
if [ -d usr/lib64 ]; then
find usr/lib64 -type f -printf "/%h/%f\n" >> filelist.lst
fi
if [ -d usr/bin ]; then
find usr/bin -type f -printf "/%h/%f\n" >> filelist.lst
fi
if [ -d usr/sbin ]; then
find usr/sbin -type f -printf "/%h/%f\n" >> filelist.lst
fi
touch doclist.lst
if [ -d usr/share/man ]; then
find usr/share/man -type f -printf "/%h/%f.gz\n" >> doclist.lst
fi
popd
mv %{buildroot}/filelist.lst .
mv %{buildroot}/doclist.lst .
%files -n python3-diagrams -f filelist.lst
%dir %{python3_sitelib}/*
%files help -f doclist.lst
%{_docdir}/*
%changelog
* Tue Apr 11 2023 Python_Bot - 0.23.3-1
- Package Spec generated