%global _empty_manifest_terminate_build 0
Name: python-tsfeatures
Version: 0.4.0
Release: 1
Summary: Calculates various features from time series data.
License: MIT License
URL: https://github.com/Nixtla/tsfeatures
Source0: https://mirrors.aliyun.com/pypi/web/packages/9a/c7/98f8aa7bf1e0078fb82a26ece9688c995bd7aeb5d46cdc6b7c294febe510/tsfeatures-0.4.0.tar.gz
BuildArch: noarch
Requires: python3-antropy
Requires: python3-arch
Requires: python3-pandas
Requires: python3-scikit-learn
Requires: python3-statsmodels
Requires: python3-supersmoother
%description
[](https://github.com/FedericoGarza/tsfeatures/tree/master)
[](https://pypi.python.org/pypi/tsfeatures/)
[](https://pepy.tech/project/tsfeatures)
[](https://www.python.org/downloads/release/python-370+/)
[](https://github.com/FedericoGarza/tsfeatures/blob/master/LICENSE)
# tsfeatures
Calculates various features from time series data. Python implementation of the R package _[tsfeatures](https://github.com/robjhyndman/tsfeatures)_.
# Installation
You can install the *released* version of `tsfeatures` from the [Python package index](pypi.org) with:
``` python
pip install tsfeatures
```
# Usage
The `tsfeatures` main function calculates by default the features used by Montero-Manso, Talagala, Hyndman and Athanasopoulos in [their implementation of the FFORMA model](https://htmlpreview.github.io/?https://github.com/robjhyndman/M4metalearning/blob/master/docs/M4_methodology.html#features).
```python
from tsfeatures import tsfeatures
```
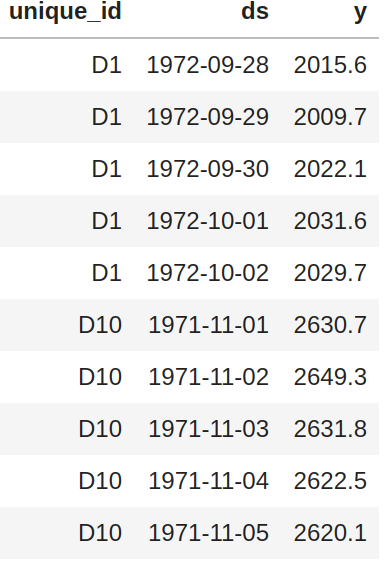
This function receives a panel pandas df with columns `unique_id`, `ds`, `y` and optionally the frequency of the data.
 ```python
tsfeatures(panel, freq=7)
```
By default (`freq=None`) the function will try to infer the frequency of each time series (using `infer_freq` from `pandas` on the `ds` column) and assign a seasonal period according to the built-in dictionary `FREQS`:
```python
FREQS = {'H': 24, 'D': 1,
'M': 12, 'Q': 4,
'W':1, 'Y': 1}
```
You can use your own dictionary using the `dict_freqs` argument:
```python
tsfeatures(panel, dict_freqs={'D': 7, 'W': 52})
```
## List of available features
| Features |||
|:--------|:------|:-------------|
|acf_features|heterogeneity|series_length|
|arch_stat|holt_parameters|sparsity|
|count_entropy|hurst|stability|
|crossing_points|hw_parameters|stl_features|
|entropy|intervals|unitroot_kpss|
|flat_spots|lumpiness|unitroot_pp|
|frequency|nonlinearity||
|guerrero|pacf_features||
See the docs for a description of the features. To use a particular feature included in the package you need to import it:
```python
from tsfeatures import acf_features
tsfeatures(panel, freq=7, features=[acf_features])
```
You can also define your own function and use it together with the included features:
```python
def number_zeros(x, freq):
number = (x == 0).sum()
return {'number_zeros': number}
tsfeatures(panel, freq=7, features=[acf_features, number_zeros])
```
`tsfeatures` can handle functions that receives a numpy array `x` and a frequency `freq` (this parameter is needed even if you don't use it) and returns a dictionary with the feature name as a key and its value.
## R implementation
You can use this package to call `tsfeatures` from R inside python (you need to have installed R, the packages `forecast` and `tsfeatures`; also the python package `rpy2`):
```python
from tsfeatures.tsfeatures_r import tsfeatures_r
tsfeatures_r(panel, freq=7, features=["acf_features"])
```
Observe that this function receives a list of strings instead of a list of functions.
## Comparison with the R implementation (sum of absolute differences)
### Non-seasonal data (100 Daily M4 time series)
| feature | diff | feature | diff | feature | diff | feature | diff |
|:----------------|-------:|:----------------|-------:|:----------------|-------:|:----------------|-------:|
| e_acf10 | 0 | e_acf1 | 0 | diff2_acf1 | 0 | alpha | 3.2 |
| seasonal_period | 0 | spike | 0 | diff1_acf10 | 0 | arch_acf | 3.3 |
| nperiods | 0 | curvature | 0 | x_acf1 | 0 | beta | 4.04 |
| linearity | 0 | crossing_points | 0 | nonlinearity | 0 | garch_r2 | 4.74 |
| hw_gamma | 0 | lumpiness | 0 | diff2x_pacf5 | 0 | hurst | 5.45 |
| hw_beta | 0 | diff1x_pacf5 | 0 | unitroot_kpss | 0 | garch_acf | 5.53 |
| hw_alpha | 0 | diff1_acf10 | 0 | x_pacf5 | 0 | entropy | 11.65 |
| trend | 0 | arch_lm | 0 | x_acf10 | 0 |
| flat_spots | 0 | diff1_acf1 | 0 | unitroot_pp | 0 |
| series_length | 0 | stability | 0 | arch_r2 | 1.37 |
To replicate this results use:
``` console
python -m tsfeatures.compare_with_r --results_directory /some/path
--dataset_name Daily --num_obs 100
```
### Sesonal data (100 Hourly M4 time series)
| feature | diff | feature | diff | feature | diff | feature | diff |
|:------------------|-------:|:-------------|-----:|:----------|--------:|:-----------|--------:|
| series_length | 0 |seas_acf1 | 0 | trend | 2.28 | hurst | 26.02 |
| flat_spots | 0 |x_acf1|0| arch_r2 | 2.29 | hw_beta | 32.39 |
| nperiods | 0 |unitroot_kpss|0| alpha | 2.52 | trough | 35 |
| crossing_points | 0 |nonlinearity|0| beta | 3.67 | peak | 69 |
| seasonal_period | 0 |diff1_acf10|0| linearity | 3.97 |
| lumpiness | 0 |x_acf10|0| curvature | 4.8 |
| stability | 0 |seas_pacf|0| e_acf10 | 7.05 |
| arch_lm | 0 |unitroot_pp|0| garch_r2 | 7.32 |
| diff2_acf1 | 0 |spike|0| hw_gamma | 7.32 |
| diff2_acf10 | 0 |seasonal_strength|0.79| hw_alpha | 7.47 |
| diff1_acf1 | 0 |e_acf1|1.67| garch_acf | 7.53 |
| diff2x_pacf5 | 0 |arch_acf|2.18| entropy | 9.45 |
To replicate this results use:
``` console
python -m tsfeatures.compare_with_r --results_directory /some/path \
--dataset_name Hourly --num_obs 100
```
# Authors
* **Federico Garza** - [FedericoGarza](https://github.com/FedericoGarza)
* **Kin Gutierrez** - [kdgutier](https://github.com/kdgutier)
* **Cristian Challu** - [cristianchallu](https://github.com/cristianchallu)
* **Jose Moralez** - [jose-moralez](https://github.com/jose-moralez)
* **Ricardo Olivares** - [rolivaresar](https://github.com/rolivaresar)
* **Max Mergenthaler** - [mergenthaler](https://github.com/mergenthaler)
%package -n python3-tsfeatures
Summary: Calculates various features from time series data.
Provides: python-tsfeatures
BuildRequires: python3-devel
BuildRequires: python3-setuptools
BuildRequires: python3-pip
%description -n python3-tsfeatures
[](https://github.com/FedericoGarza/tsfeatures/tree/master)
[](https://pypi.python.org/pypi/tsfeatures/)
[](https://pepy.tech/project/tsfeatures)
[](https://www.python.org/downloads/release/python-370+/)
[](https://github.com/FedericoGarza/tsfeatures/blob/master/LICENSE)
# tsfeatures
Calculates various features from time series data. Python implementation of the R package _[tsfeatures](https://github.com/robjhyndman/tsfeatures)_.
# Installation
You can install the *released* version of `tsfeatures` from the [Python package index](pypi.org) with:
``` python
pip install tsfeatures
```
# Usage
The `tsfeatures` main function calculates by default the features used by Montero-Manso, Talagala, Hyndman and Athanasopoulos in [their implementation of the FFORMA model](https://htmlpreview.github.io/?https://github.com/robjhyndman/M4metalearning/blob/master/docs/M4_methodology.html#features).
```python
from tsfeatures import tsfeatures
```
This function receives a panel pandas df with columns `unique_id`, `ds`, `y` and optionally the frequency of the data.
```python
tsfeatures(panel, freq=7)
```
By default (`freq=None`) the function will try to infer the frequency of each time series (using `infer_freq` from `pandas` on the `ds` column) and assign a seasonal period according to the built-in dictionary `FREQS`:
```python
FREQS = {'H': 24, 'D': 1,
'M': 12, 'Q': 4,
'W':1, 'Y': 1}
```
You can use your own dictionary using the `dict_freqs` argument:
```python
tsfeatures(panel, dict_freqs={'D': 7, 'W': 52})
```
## List of available features
| Features |||
|:--------|:------|:-------------|
|acf_features|heterogeneity|series_length|
|arch_stat|holt_parameters|sparsity|
|count_entropy|hurst|stability|
|crossing_points|hw_parameters|stl_features|
|entropy|intervals|unitroot_kpss|
|flat_spots|lumpiness|unitroot_pp|
|frequency|nonlinearity||
|guerrero|pacf_features||
See the docs for a description of the features. To use a particular feature included in the package you need to import it:
```python
from tsfeatures import acf_features
tsfeatures(panel, freq=7, features=[acf_features])
```
You can also define your own function and use it together with the included features:
```python
def number_zeros(x, freq):
number = (x == 0).sum()
return {'number_zeros': number}
tsfeatures(panel, freq=7, features=[acf_features, number_zeros])
```
`tsfeatures` can handle functions that receives a numpy array `x` and a frequency `freq` (this parameter is needed even if you don't use it) and returns a dictionary with the feature name as a key and its value.
## R implementation
You can use this package to call `tsfeatures` from R inside python (you need to have installed R, the packages `forecast` and `tsfeatures`; also the python package `rpy2`):
```python
from tsfeatures.tsfeatures_r import tsfeatures_r
tsfeatures_r(panel, freq=7, features=["acf_features"])
```
Observe that this function receives a list of strings instead of a list of functions.
## Comparison with the R implementation (sum of absolute differences)
### Non-seasonal data (100 Daily M4 time series)
| feature | diff | feature | diff | feature | diff | feature | diff |
|:----------------|-------:|:----------------|-------:|:----------------|-------:|:----------------|-------:|
| e_acf10 | 0 | e_acf1 | 0 | diff2_acf1 | 0 | alpha | 3.2 |
| seasonal_period | 0 | spike | 0 | diff1_acf10 | 0 | arch_acf | 3.3 |
| nperiods | 0 | curvature | 0 | x_acf1 | 0 | beta | 4.04 |
| linearity | 0 | crossing_points | 0 | nonlinearity | 0 | garch_r2 | 4.74 |
| hw_gamma | 0 | lumpiness | 0 | diff2x_pacf5 | 0 | hurst | 5.45 |
| hw_beta | 0 | diff1x_pacf5 | 0 | unitroot_kpss | 0 | garch_acf | 5.53 |
| hw_alpha | 0 | diff1_acf10 | 0 | x_pacf5 | 0 | entropy | 11.65 |
| trend | 0 | arch_lm | 0 | x_acf10 | 0 |
| flat_spots | 0 | diff1_acf1 | 0 | unitroot_pp | 0 |
| series_length | 0 | stability | 0 | arch_r2 | 1.37 |
To replicate this results use:
``` console
python -m tsfeatures.compare_with_r --results_directory /some/path
--dataset_name Daily --num_obs 100
```
### Sesonal data (100 Hourly M4 time series)
| feature | diff | feature | diff | feature | diff | feature | diff |
|:------------------|-------:|:-------------|-----:|:----------|--------:|:-----------|--------:|
| series_length | 0 |seas_acf1 | 0 | trend | 2.28 | hurst | 26.02 |
| flat_spots | 0 |x_acf1|0| arch_r2 | 2.29 | hw_beta | 32.39 |
| nperiods | 0 |unitroot_kpss|0| alpha | 2.52 | trough | 35 |
| crossing_points | 0 |nonlinearity|0| beta | 3.67 | peak | 69 |
| seasonal_period | 0 |diff1_acf10|0| linearity | 3.97 |
| lumpiness | 0 |x_acf10|0| curvature | 4.8 |
| stability | 0 |seas_pacf|0| e_acf10 | 7.05 |
| arch_lm | 0 |unitroot_pp|0| garch_r2 | 7.32 |
| diff2_acf1 | 0 |spike|0| hw_gamma | 7.32 |
| diff2_acf10 | 0 |seasonal_strength|0.79| hw_alpha | 7.47 |
| diff1_acf1 | 0 |e_acf1|1.67| garch_acf | 7.53 |
| diff2x_pacf5 | 0 |arch_acf|2.18| entropy | 9.45 |
To replicate this results use:
``` console
python -m tsfeatures.compare_with_r --results_directory /some/path \
--dataset_name Hourly --num_obs 100
```
# Authors
* **Federico Garza** - [FedericoGarza](https://github.com/FedericoGarza)
* **Kin Gutierrez** - [kdgutier](https://github.com/kdgutier)
* **Cristian Challu** - [cristianchallu](https://github.com/cristianchallu)
* **Jose Moralez** - [jose-moralez](https://github.com/jose-moralez)
* **Ricardo Olivares** - [rolivaresar](https://github.com/rolivaresar)
* **Max Mergenthaler** - [mergenthaler](https://github.com/mergenthaler)
%package help
Summary: Development documents and examples for tsfeatures
Provides: python3-tsfeatures-doc
%description help
[](https://github.com/FedericoGarza/tsfeatures/tree/master)
[](https://pypi.python.org/pypi/tsfeatures/)
[](https://pepy.tech/project/tsfeatures)
[](https://www.python.org/downloads/release/python-370+/)
[](https://github.com/FedericoGarza/tsfeatures/blob/master/LICENSE)
# tsfeatures
Calculates various features from time series data. Python implementation of the R package _[tsfeatures](https://github.com/robjhyndman/tsfeatures)_.
# Installation
You can install the *released* version of `tsfeatures` from the [Python package index](pypi.org) with:
``` python
pip install tsfeatures
```
# Usage
The `tsfeatures` main function calculates by default the features used by Montero-Manso, Talagala, Hyndman and Athanasopoulos in [their implementation of the FFORMA model](https://htmlpreview.github.io/?https://github.com/robjhyndman/M4metalearning/blob/master/docs/M4_methodology.html#features).
```python
from tsfeatures import tsfeatures
```
This function receives a panel pandas df with columns `unique_id`, `ds`, `y` and optionally the frequency of the data.
```python
tsfeatures(panel, freq=7)
```
By default (`freq=None`) the function will try to infer the frequency of each time series (using `infer_freq` from `pandas` on the `ds` column) and assign a seasonal period according to the built-in dictionary `FREQS`:
```python
FREQS = {'H': 24, 'D': 1,
'M': 12, 'Q': 4,
'W':1, 'Y': 1}
```
You can use your own dictionary using the `dict_freqs` argument:
```python
tsfeatures(panel, dict_freqs={'D': 7, 'W': 52})
```
## List of available features
| Features |||
|:--------|:------|:-------------|
|acf_features|heterogeneity|series_length|
|arch_stat|holt_parameters|sparsity|
|count_entropy|hurst|stability|
|crossing_points|hw_parameters|stl_features|
|entropy|intervals|unitroot_kpss|
|flat_spots|lumpiness|unitroot_pp|
|frequency|nonlinearity||
|guerrero|pacf_features||
See the docs for a description of the features. To use a particular feature included in the package you need to import it:
```python
from tsfeatures import acf_features
tsfeatures(panel, freq=7, features=[acf_features])
```
You can also define your own function and use it together with the included features:
```python
def number_zeros(x, freq):
number = (x == 0).sum()
return {'number_zeros': number}
tsfeatures(panel, freq=7, features=[acf_features, number_zeros])
```
`tsfeatures` can handle functions that receives a numpy array `x` and a frequency `freq` (this parameter is needed even if you don't use it) and returns a dictionary with the feature name as a key and its value.
## R implementation
You can use this package to call `tsfeatures` from R inside python (you need to have installed R, the packages `forecast` and `tsfeatures`; also the python package `rpy2`):
```python
from tsfeatures.tsfeatures_r import tsfeatures_r
tsfeatures_r(panel, freq=7, features=["acf_features"])
```
Observe that this function receives a list of strings instead of a list of functions.
## Comparison with the R implementation (sum of absolute differences)
### Non-seasonal data (100 Daily M4 time series)
| feature | diff | feature | diff | feature | diff | feature | diff |
|:----------------|-------:|:----------------|-------:|:----------------|-------:|:----------------|-------:|
| e_acf10 | 0 | e_acf1 | 0 | diff2_acf1 | 0 | alpha | 3.2 |
| seasonal_period | 0 | spike | 0 | diff1_acf10 | 0 | arch_acf | 3.3 |
| nperiods | 0 | curvature | 0 | x_acf1 | 0 | beta | 4.04 |
| linearity | 0 | crossing_points | 0 | nonlinearity | 0 | garch_r2 | 4.74 |
| hw_gamma | 0 | lumpiness | 0 | diff2x_pacf5 | 0 | hurst | 5.45 |
| hw_beta | 0 | diff1x_pacf5 | 0 | unitroot_kpss | 0 | garch_acf | 5.53 |
| hw_alpha | 0 | diff1_acf10 | 0 | x_pacf5 | 0 | entropy | 11.65 |
| trend | 0 | arch_lm | 0 | x_acf10 | 0 |
| flat_spots | 0 | diff1_acf1 | 0 | unitroot_pp | 0 |
| series_length | 0 | stability | 0 | arch_r2 | 1.37 |
To replicate this results use:
``` console
python -m tsfeatures.compare_with_r --results_directory /some/path
--dataset_name Daily --num_obs 100
```
### Sesonal data (100 Hourly M4 time series)
| feature | diff | feature | diff | feature | diff | feature | diff |
|:------------------|-------:|:-------------|-----:|:----------|--------:|:-----------|--------:|
| series_length | 0 |seas_acf1 | 0 | trend | 2.28 | hurst | 26.02 |
| flat_spots | 0 |x_acf1|0| arch_r2 | 2.29 | hw_beta | 32.39 |
| nperiods | 0 |unitroot_kpss|0| alpha | 2.52 | trough | 35 |
| crossing_points | 0 |nonlinearity|0| beta | 3.67 | peak | 69 |
| seasonal_period | 0 |diff1_acf10|0| linearity | 3.97 |
| lumpiness | 0 |x_acf10|0| curvature | 4.8 |
| stability | 0 |seas_pacf|0| e_acf10 | 7.05 |
| arch_lm | 0 |unitroot_pp|0| garch_r2 | 7.32 |
| diff2_acf1 | 0 |spike|0| hw_gamma | 7.32 |
| diff2_acf10 | 0 |seasonal_strength|0.79| hw_alpha | 7.47 |
| diff1_acf1 | 0 |e_acf1|1.67| garch_acf | 7.53 |
| diff2x_pacf5 | 0 |arch_acf|2.18| entropy | 9.45 |
To replicate this results use:
``` console
python -m tsfeatures.compare_with_r --results_directory /some/path \
--dataset_name Hourly --num_obs 100
```
# Authors
* **Federico Garza** - [FedericoGarza](https://github.com/FedericoGarza)
* **Kin Gutierrez** - [kdgutier](https://github.com/kdgutier)
* **Cristian Challu** - [cristianchallu](https://github.com/cristianchallu)
* **Jose Moralez** - [jose-moralez](https://github.com/jose-moralez)
* **Ricardo Olivares** - [rolivaresar](https://github.com/rolivaresar)
* **Max Mergenthaler** - [mergenthaler](https://github.com/mergenthaler)
%prep
%autosetup -n tsfeatures-0.4.0
%build
%py3_build
%install
%py3_install
install -d -m755 %{buildroot}/%{_pkgdocdir}
if [ -d doc ]; then cp -arf doc %{buildroot}/%{_pkgdocdir}; fi
if [ -d docs ]; then cp -arf docs %{buildroot}/%{_pkgdocdir}; fi
if [ -d example ]; then cp -arf example %{buildroot}/%{_pkgdocdir}; fi
if [ -d examples ]; then cp -arf examples %{buildroot}/%{_pkgdocdir}; fi
pushd %{buildroot}
if [ -d usr/lib ]; then
find usr/lib -type f -printf "\"/%h/%f\"\n" >> filelist.lst
fi
if [ -d usr/lib64 ]; then
find usr/lib64 -type f -printf "\"/%h/%f\"\n" >> filelist.lst
fi
if [ -d usr/bin ]; then
find usr/bin -type f -printf "\"/%h/%f\"\n" >> filelist.lst
fi
if [ -d usr/sbin ]; then
find usr/sbin -type f -printf "\"/%h/%f\"\n" >> filelist.lst
fi
touch doclist.lst
if [ -d usr/share/man ]; then
find usr/share/man -type f -printf "\"/%h/%f.gz\"\n" >> doclist.lst
fi
popd
mv %{buildroot}/filelist.lst .
mv %{buildroot}/doclist.lst .
%files -n python3-tsfeatures -f filelist.lst
%dir %{python3_sitelib}/*
%files help -f doclist.lst
%{_docdir}/*
%changelog
* Fri Jun 09 2023 Python_Bot - 0.4.0-1
- Package Spec generated
```python
tsfeatures(panel, freq=7)
```
By default (`freq=None`) the function will try to infer the frequency of each time series (using `infer_freq` from `pandas` on the `ds` column) and assign a seasonal period according to the built-in dictionary `FREQS`:
```python
FREQS = {'H': 24, 'D': 1,
'M': 12, 'Q': 4,
'W':1, 'Y': 1}
```
You can use your own dictionary using the `dict_freqs` argument:
```python
tsfeatures(panel, dict_freqs={'D': 7, 'W': 52})
```
## List of available features
| Features |||
|:--------|:------|:-------------|
|acf_features|heterogeneity|series_length|
|arch_stat|holt_parameters|sparsity|
|count_entropy|hurst|stability|
|crossing_points|hw_parameters|stl_features|
|entropy|intervals|unitroot_kpss|
|flat_spots|lumpiness|unitroot_pp|
|frequency|nonlinearity||
|guerrero|pacf_features||
See the docs for a description of the features. To use a particular feature included in the package you need to import it:
```python
from tsfeatures import acf_features
tsfeatures(panel, freq=7, features=[acf_features])
```
You can also define your own function and use it together with the included features:
```python
def number_zeros(x, freq):
number = (x == 0).sum()
return {'number_zeros': number}
tsfeatures(panel, freq=7, features=[acf_features, number_zeros])
```
`tsfeatures` can handle functions that receives a numpy array `x` and a frequency `freq` (this parameter is needed even if you don't use it) and returns a dictionary with the feature name as a key and its value.
## R implementation
You can use this package to call `tsfeatures` from R inside python (you need to have installed R, the packages `forecast` and `tsfeatures`; also the python package `rpy2`):
```python
from tsfeatures.tsfeatures_r import tsfeatures_r
tsfeatures_r(panel, freq=7, features=["acf_features"])
```
Observe that this function receives a list of strings instead of a list of functions.
## Comparison with the R implementation (sum of absolute differences)
### Non-seasonal data (100 Daily M4 time series)
| feature | diff | feature | diff | feature | diff | feature | diff |
|:----------------|-------:|:----------------|-------:|:----------------|-------:|:----------------|-------:|
| e_acf10 | 0 | e_acf1 | 0 | diff2_acf1 | 0 | alpha | 3.2 |
| seasonal_period | 0 | spike | 0 | diff1_acf10 | 0 | arch_acf | 3.3 |
| nperiods | 0 | curvature | 0 | x_acf1 | 0 | beta | 4.04 |
| linearity | 0 | crossing_points | 0 | nonlinearity | 0 | garch_r2 | 4.74 |
| hw_gamma | 0 | lumpiness | 0 | diff2x_pacf5 | 0 | hurst | 5.45 |
| hw_beta | 0 | diff1x_pacf5 | 0 | unitroot_kpss | 0 | garch_acf | 5.53 |
| hw_alpha | 0 | diff1_acf10 | 0 | x_pacf5 | 0 | entropy | 11.65 |
| trend | 0 | arch_lm | 0 | x_acf10 | 0 |
| flat_spots | 0 | diff1_acf1 | 0 | unitroot_pp | 0 |
| series_length | 0 | stability | 0 | arch_r2 | 1.37 |
To replicate this results use:
``` console
python -m tsfeatures.compare_with_r --results_directory /some/path
--dataset_name Daily --num_obs 100
```
### Sesonal data (100 Hourly M4 time series)
| feature | diff | feature | diff | feature | diff | feature | diff |
|:------------------|-------:|:-------------|-----:|:----------|--------:|:-----------|--------:|
| series_length | 0 |seas_acf1 | 0 | trend | 2.28 | hurst | 26.02 |
| flat_spots | 0 |x_acf1|0| arch_r2 | 2.29 | hw_beta | 32.39 |
| nperiods | 0 |unitroot_kpss|0| alpha | 2.52 | trough | 35 |
| crossing_points | 0 |nonlinearity|0| beta | 3.67 | peak | 69 |
| seasonal_period | 0 |diff1_acf10|0| linearity | 3.97 |
| lumpiness | 0 |x_acf10|0| curvature | 4.8 |
| stability | 0 |seas_pacf|0| e_acf10 | 7.05 |
| arch_lm | 0 |unitroot_pp|0| garch_r2 | 7.32 |
| diff2_acf1 | 0 |spike|0| hw_gamma | 7.32 |
| diff2_acf10 | 0 |seasonal_strength|0.79| hw_alpha | 7.47 |
| diff1_acf1 | 0 |e_acf1|1.67| garch_acf | 7.53 |
| diff2x_pacf5 | 0 |arch_acf|2.18| entropy | 9.45 |
To replicate this results use:
``` console
python -m tsfeatures.compare_with_r --results_directory /some/path \
--dataset_name Hourly --num_obs 100
```
# Authors
* **Federico Garza** - [FedericoGarza](https://github.com/FedericoGarza)
* **Kin Gutierrez** - [kdgutier](https://github.com/kdgutier)
* **Cristian Challu** - [cristianchallu](https://github.com/cristianchallu)
* **Jose Moralez** - [jose-moralez](https://github.com/jose-moralez)
* **Ricardo Olivares** - [rolivaresar](https://github.com/rolivaresar)
* **Max Mergenthaler** - [mergenthaler](https://github.com/mergenthaler)
%package -n python3-tsfeatures
Summary: Calculates various features from time series data.
Provides: python-tsfeatures
BuildRequires: python3-devel
BuildRequires: python3-setuptools
BuildRequires: python3-pip
%description -n python3-tsfeatures
[](https://github.com/FedericoGarza/tsfeatures/tree/master)
[](https://pypi.python.org/pypi/tsfeatures/)
[](https://pepy.tech/project/tsfeatures)
[](https://www.python.org/downloads/release/python-370+/)
[](https://github.com/FedericoGarza/tsfeatures/blob/master/LICENSE)
# tsfeatures
Calculates various features from time series data. Python implementation of the R package _[tsfeatures](https://github.com/robjhyndman/tsfeatures)_.
# Installation
You can install the *released* version of `tsfeatures` from the [Python package index](pypi.org) with:
``` python
pip install tsfeatures
```
# Usage
The `tsfeatures` main function calculates by default the features used by Montero-Manso, Talagala, Hyndman and Athanasopoulos in [their implementation of the FFORMA model](https://htmlpreview.github.io/?https://github.com/robjhyndman/M4metalearning/blob/master/docs/M4_methodology.html#features).
```python
from tsfeatures import tsfeatures
```
This function receives a panel pandas df with columns `unique_id`, `ds`, `y` and optionally the frequency of the data.
```python
tsfeatures(panel, freq=7)
```
By default (`freq=None`) the function will try to infer the frequency of each time series (using `infer_freq` from `pandas` on the `ds` column) and assign a seasonal period according to the built-in dictionary `FREQS`:
```python
FREQS = {'H': 24, 'D': 1,
'M': 12, 'Q': 4,
'W':1, 'Y': 1}
```
You can use your own dictionary using the `dict_freqs` argument:
```python
tsfeatures(panel, dict_freqs={'D': 7, 'W': 52})
```
## List of available features
| Features |||
|:--------|:------|:-------------|
|acf_features|heterogeneity|series_length|
|arch_stat|holt_parameters|sparsity|
|count_entropy|hurst|stability|
|crossing_points|hw_parameters|stl_features|
|entropy|intervals|unitroot_kpss|
|flat_spots|lumpiness|unitroot_pp|
|frequency|nonlinearity||
|guerrero|pacf_features||
See the docs for a description of the features. To use a particular feature included in the package you need to import it:
```python
from tsfeatures import acf_features
tsfeatures(panel, freq=7, features=[acf_features])
```
You can also define your own function and use it together with the included features:
```python
def number_zeros(x, freq):
number = (x == 0).sum()
return {'number_zeros': number}
tsfeatures(panel, freq=7, features=[acf_features, number_zeros])
```
`tsfeatures` can handle functions that receives a numpy array `x` and a frequency `freq` (this parameter is needed even if you don't use it) and returns a dictionary with the feature name as a key and its value.
## R implementation
You can use this package to call `tsfeatures` from R inside python (you need to have installed R, the packages `forecast` and `tsfeatures`; also the python package `rpy2`):
```python
from tsfeatures.tsfeatures_r import tsfeatures_r
tsfeatures_r(panel, freq=7, features=["acf_features"])
```
Observe that this function receives a list of strings instead of a list of functions.
## Comparison with the R implementation (sum of absolute differences)
### Non-seasonal data (100 Daily M4 time series)
| feature | diff | feature | diff | feature | diff | feature | diff |
|:----------------|-------:|:----------------|-------:|:----------------|-------:|:----------------|-------:|
| e_acf10 | 0 | e_acf1 | 0 | diff2_acf1 | 0 | alpha | 3.2 |
| seasonal_period | 0 | spike | 0 | diff1_acf10 | 0 | arch_acf | 3.3 |
| nperiods | 0 | curvature | 0 | x_acf1 | 0 | beta | 4.04 |
| linearity | 0 | crossing_points | 0 | nonlinearity | 0 | garch_r2 | 4.74 |
| hw_gamma | 0 | lumpiness | 0 | diff2x_pacf5 | 0 | hurst | 5.45 |
| hw_beta | 0 | diff1x_pacf5 | 0 | unitroot_kpss | 0 | garch_acf | 5.53 |
| hw_alpha | 0 | diff1_acf10 | 0 | x_pacf5 | 0 | entropy | 11.65 |
| trend | 0 | arch_lm | 0 | x_acf10 | 0 |
| flat_spots | 0 | diff1_acf1 | 0 | unitroot_pp | 0 |
| series_length | 0 | stability | 0 | arch_r2 | 1.37 |
To replicate this results use:
``` console
python -m tsfeatures.compare_with_r --results_directory /some/path
--dataset_name Daily --num_obs 100
```
### Sesonal data (100 Hourly M4 time series)
| feature | diff | feature | diff | feature | diff | feature | diff |
|:------------------|-------:|:-------------|-----:|:----------|--------:|:-----------|--------:|
| series_length | 0 |seas_acf1 | 0 | trend | 2.28 | hurst | 26.02 |
| flat_spots | 0 |x_acf1|0| arch_r2 | 2.29 | hw_beta | 32.39 |
| nperiods | 0 |unitroot_kpss|0| alpha | 2.52 | trough | 35 |
| crossing_points | 0 |nonlinearity|0| beta | 3.67 | peak | 69 |
| seasonal_period | 0 |diff1_acf10|0| linearity | 3.97 |
| lumpiness | 0 |x_acf10|0| curvature | 4.8 |
| stability | 0 |seas_pacf|0| e_acf10 | 7.05 |
| arch_lm | 0 |unitroot_pp|0| garch_r2 | 7.32 |
| diff2_acf1 | 0 |spike|0| hw_gamma | 7.32 |
| diff2_acf10 | 0 |seasonal_strength|0.79| hw_alpha | 7.47 |
| diff1_acf1 | 0 |e_acf1|1.67| garch_acf | 7.53 |
| diff2x_pacf5 | 0 |arch_acf|2.18| entropy | 9.45 |
To replicate this results use:
``` console
python -m tsfeatures.compare_with_r --results_directory /some/path \
--dataset_name Hourly --num_obs 100
```
# Authors
* **Federico Garza** - [FedericoGarza](https://github.com/FedericoGarza)
* **Kin Gutierrez** - [kdgutier](https://github.com/kdgutier)
* **Cristian Challu** - [cristianchallu](https://github.com/cristianchallu)
* **Jose Moralez** - [jose-moralez](https://github.com/jose-moralez)
* **Ricardo Olivares** - [rolivaresar](https://github.com/rolivaresar)
* **Max Mergenthaler** - [mergenthaler](https://github.com/mergenthaler)
%package help
Summary: Development documents and examples for tsfeatures
Provides: python3-tsfeatures-doc
%description help
[](https://github.com/FedericoGarza/tsfeatures/tree/master)
[](https://pypi.python.org/pypi/tsfeatures/)
[](https://pepy.tech/project/tsfeatures)
[](https://www.python.org/downloads/release/python-370+/)
[](https://github.com/FedericoGarza/tsfeatures/blob/master/LICENSE)
# tsfeatures
Calculates various features from time series data. Python implementation of the R package _[tsfeatures](https://github.com/robjhyndman/tsfeatures)_.
# Installation
You can install the *released* version of `tsfeatures` from the [Python package index](pypi.org) with:
``` python
pip install tsfeatures
```
# Usage
The `tsfeatures` main function calculates by default the features used by Montero-Manso, Talagala, Hyndman and Athanasopoulos in [their implementation of the FFORMA model](https://htmlpreview.github.io/?https://github.com/robjhyndman/M4metalearning/blob/master/docs/M4_methodology.html#features).
```python
from tsfeatures import tsfeatures
```
This function receives a panel pandas df with columns `unique_id`, `ds`, `y` and optionally the frequency of the data.
```python
tsfeatures(panel, freq=7)
```
By default (`freq=None`) the function will try to infer the frequency of each time series (using `infer_freq` from `pandas` on the `ds` column) and assign a seasonal period according to the built-in dictionary `FREQS`:
```python
FREQS = {'H': 24, 'D': 1,
'M': 12, 'Q': 4,
'W':1, 'Y': 1}
```
You can use your own dictionary using the `dict_freqs` argument:
```python
tsfeatures(panel, dict_freqs={'D': 7, 'W': 52})
```
## List of available features
| Features |||
|:--------|:------|:-------------|
|acf_features|heterogeneity|series_length|
|arch_stat|holt_parameters|sparsity|
|count_entropy|hurst|stability|
|crossing_points|hw_parameters|stl_features|
|entropy|intervals|unitroot_kpss|
|flat_spots|lumpiness|unitroot_pp|
|frequency|nonlinearity||
|guerrero|pacf_features||
See the docs for a description of the features. To use a particular feature included in the package you need to import it:
```python
from tsfeatures import acf_features
tsfeatures(panel, freq=7, features=[acf_features])
```
You can also define your own function and use it together with the included features:
```python
def number_zeros(x, freq):
number = (x == 0).sum()
return {'number_zeros': number}
tsfeatures(panel, freq=7, features=[acf_features, number_zeros])
```
`tsfeatures` can handle functions that receives a numpy array `x` and a frequency `freq` (this parameter is needed even if you don't use it) and returns a dictionary with the feature name as a key and its value.
## R implementation
You can use this package to call `tsfeatures` from R inside python (you need to have installed R, the packages `forecast` and `tsfeatures`; also the python package `rpy2`):
```python
from tsfeatures.tsfeatures_r import tsfeatures_r
tsfeatures_r(panel, freq=7, features=["acf_features"])
```
Observe that this function receives a list of strings instead of a list of functions.
## Comparison with the R implementation (sum of absolute differences)
### Non-seasonal data (100 Daily M4 time series)
| feature | diff | feature | diff | feature | diff | feature | diff |
|:----------------|-------:|:----------------|-------:|:----------------|-------:|:----------------|-------:|
| e_acf10 | 0 | e_acf1 | 0 | diff2_acf1 | 0 | alpha | 3.2 |
| seasonal_period | 0 | spike | 0 | diff1_acf10 | 0 | arch_acf | 3.3 |
| nperiods | 0 | curvature | 0 | x_acf1 | 0 | beta | 4.04 |
| linearity | 0 | crossing_points | 0 | nonlinearity | 0 | garch_r2 | 4.74 |
| hw_gamma | 0 | lumpiness | 0 | diff2x_pacf5 | 0 | hurst | 5.45 |
| hw_beta | 0 | diff1x_pacf5 | 0 | unitroot_kpss | 0 | garch_acf | 5.53 |
| hw_alpha | 0 | diff1_acf10 | 0 | x_pacf5 | 0 | entropy | 11.65 |
| trend | 0 | arch_lm | 0 | x_acf10 | 0 |
| flat_spots | 0 | diff1_acf1 | 0 | unitroot_pp | 0 |
| series_length | 0 | stability | 0 | arch_r2 | 1.37 |
To replicate this results use:
``` console
python -m tsfeatures.compare_with_r --results_directory /some/path
--dataset_name Daily --num_obs 100
```
### Sesonal data (100 Hourly M4 time series)
| feature | diff | feature | diff | feature | diff | feature | diff |
|:------------------|-------:|:-------------|-----:|:----------|--------:|:-----------|--------:|
| series_length | 0 |seas_acf1 | 0 | trend | 2.28 | hurst | 26.02 |
| flat_spots | 0 |x_acf1|0| arch_r2 | 2.29 | hw_beta | 32.39 |
| nperiods | 0 |unitroot_kpss|0| alpha | 2.52 | trough | 35 |
| crossing_points | 0 |nonlinearity|0| beta | 3.67 | peak | 69 |
| seasonal_period | 0 |diff1_acf10|0| linearity | 3.97 |
| lumpiness | 0 |x_acf10|0| curvature | 4.8 |
| stability | 0 |seas_pacf|0| e_acf10 | 7.05 |
| arch_lm | 0 |unitroot_pp|0| garch_r2 | 7.32 |
| diff2_acf1 | 0 |spike|0| hw_gamma | 7.32 |
| diff2_acf10 | 0 |seasonal_strength|0.79| hw_alpha | 7.47 |
| diff1_acf1 | 0 |e_acf1|1.67| garch_acf | 7.53 |
| diff2x_pacf5 | 0 |arch_acf|2.18| entropy | 9.45 |
To replicate this results use:
``` console
python -m tsfeatures.compare_with_r --results_directory /some/path \
--dataset_name Hourly --num_obs 100
```
# Authors
* **Federico Garza** - [FedericoGarza](https://github.com/FedericoGarza)
* **Kin Gutierrez** - [kdgutier](https://github.com/kdgutier)
* **Cristian Challu** - [cristianchallu](https://github.com/cristianchallu)
* **Jose Moralez** - [jose-moralez](https://github.com/jose-moralez)
* **Ricardo Olivares** - [rolivaresar](https://github.com/rolivaresar)
* **Max Mergenthaler** - [mergenthaler](https://github.com/mergenthaler)
%prep
%autosetup -n tsfeatures-0.4.0
%build
%py3_build
%install
%py3_install
install -d -m755 %{buildroot}/%{_pkgdocdir}
if [ -d doc ]; then cp -arf doc %{buildroot}/%{_pkgdocdir}; fi
if [ -d docs ]; then cp -arf docs %{buildroot}/%{_pkgdocdir}; fi
if [ -d example ]; then cp -arf example %{buildroot}/%{_pkgdocdir}; fi
if [ -d examples ]; then cp -arf examples %{buildroot}/%{_pkgdocdir}; fi
pushd %{buildroot}
if [ -d usr/lib ]; then
find usr/lib -type f -printf "\"/%h/%f\"\n" >> filelist.lst
fi
if [ -d usr/lib64 ]; then
find usr/lib64 -type f -printf "\"/%h/%f\"\n" >> filelist.lst
fi
if [ -d usr/bin ]; then
find usr/bin -type f -printf "\"/%h/%f\"\n" >> filelist.lst
fi
if [ -d usr/sbin ]; then
find usr/sbin -type f -printf "\"/%h/%f\"\n" >> filelist.lst
fi
touch doclist.lst
if [ -d usr/share/man ]; then
find usr/share/man -type f -printf "\"/%h/%f.gz\"\n" >> doclist.lst
fi
popd
mv %{buildroot}/filelist.lst .
mv %{buildroot}/doclist.lst .
%files -n python3-tsfeatures -f filelist.lst
%dir %{python3_sitelib}/*
%files help -f doclist.lst
%{_docdir}/*
%changelog
* Fri Jun 09 2023 Python_Bot - 0.4.0-1
- Package Spec generated