%global _empty_manifest_terminate_build 0
Name: python-exmol
Version: 3.0.3
Release: 1
Summary: Counterfactual generation with STONED SELFIES
License: MIT
URL: https://ur-whitelab.github.io/exmol/
Source0: https://mirrors.aliyun.com/pypi/web/packages/48/74/662927d932e358654aea9b359ab2b814516e4c7114b72905bdaedaf89628/exmol-3.0.3.tar.gz
BuildArch: noarch
Requires: python3-selfies
Requires: python3-numpy
Requires: python3-requests
Requires: python3-tqdm
Requires: python3-ratelimit
Requires: python3-rdkit
Requires: python3-scikit-learn
Requires: python3-skunk
Requires: python3-importlib-resources
Requires: python3-synspace
Requires: python3-langchain
%description
# Explaining why that molecule
[](https://github.com/ur-whitelab/exmol)
[](https://github.com/ur-whitelab/exmol) [](https://github.com/ur-whitelab/exmol) [](https://ur-whitelab.github.io/exmol/)
[](https://badge.fury.io/py/exmol)
[](https://lbesson.mit-license.org/)
- [Explaining why that molecule](#explaining-why-that-molecule)
- [Install](#install)
- [Quickstart](#quickstart)
- [Counterfactual Generation](#counterfactual-generation)
- [Descriptor Attribution](#descriptor-attribution)
- [Usage](#usage)
- [Further Examples](#further-examples)
- [Chemical Space](#chemical-space)
- [SVG](#svg)
- [Disable Progress Bars](#disable-progress-bars)
- [API and Docs](#api-and-docs)
- [Developing](#developing)
- [Citation](#citation)
`exmol` is a package to explain black-box predictions of molecules. The package uses model agnostic explanations to help users understand why a molecule is predicted to have a property.
## Install
```sh
pip install exmol
```
## Quickstart
See [the tutorial](https://ur-whitelab.github.io/exmol/paper2_LIME/Tutorial.html) to give an overview of the basic usage of exmol.
## Counterfactual Generation
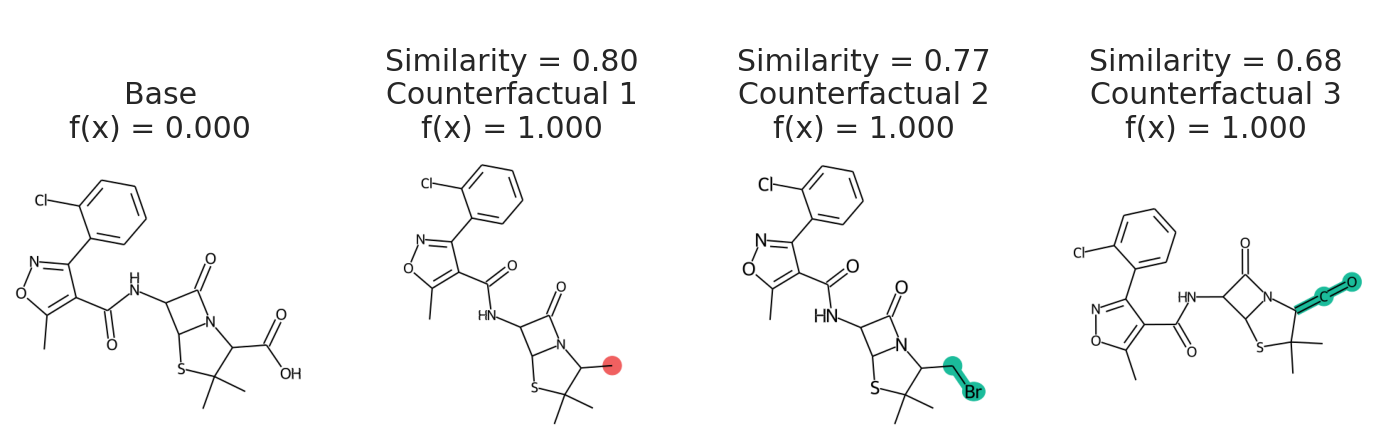
Our package implements the Model Agnostic Counterfactual Compounds with STONED to generate counterfactuals.
A counterfactual can explain a prediction by showing what would have to change in the molecule to change its predicted class. Here is an example of a counterfactual:
> This package is not popular. If the package had a logo, it would be popular.
In addition to having a changed prediction, a molecular counterfactual must be similar to its base molecule as much as possible. Here is an example of a molecular counterfactual:
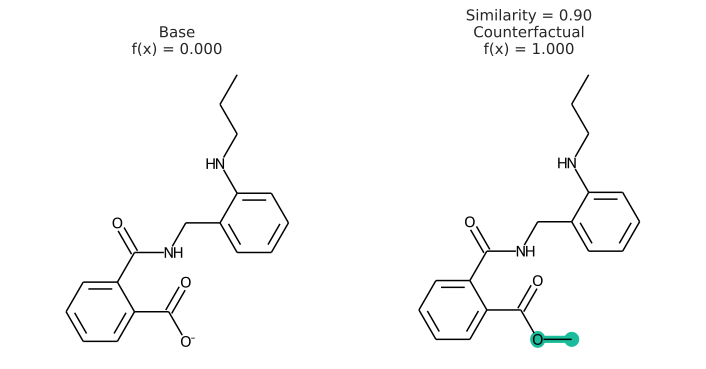 The counterfactual shows that if the carboxylic acid were an ester, the molecule would be active. It is up to the user to translate this set of structures into a meaningful sentence.
## Descriptor Attribution
This package also implements Model Agnostic Descriptor Attribution for molecules using LIME.
Descriptor attributions can explain a prediction by computing QSARs for molecular structure properties independent of features used for model predictions. Here is an example of descriptor attribution:
The counterfactual shows that if the carboxylic acid were an ester, the molecule would be active. It is up to the user to translate this set of structures into a meaningful sentence.
## Descriptor Attribution
This package also implements Model Agnostic Descriptor Attribution for molecules using LIME.
Descriptor attributions can explain a prediction by computing QSARs for molecular structure properties independent of features used for model predictions. Here is an example of descriptor attribution:
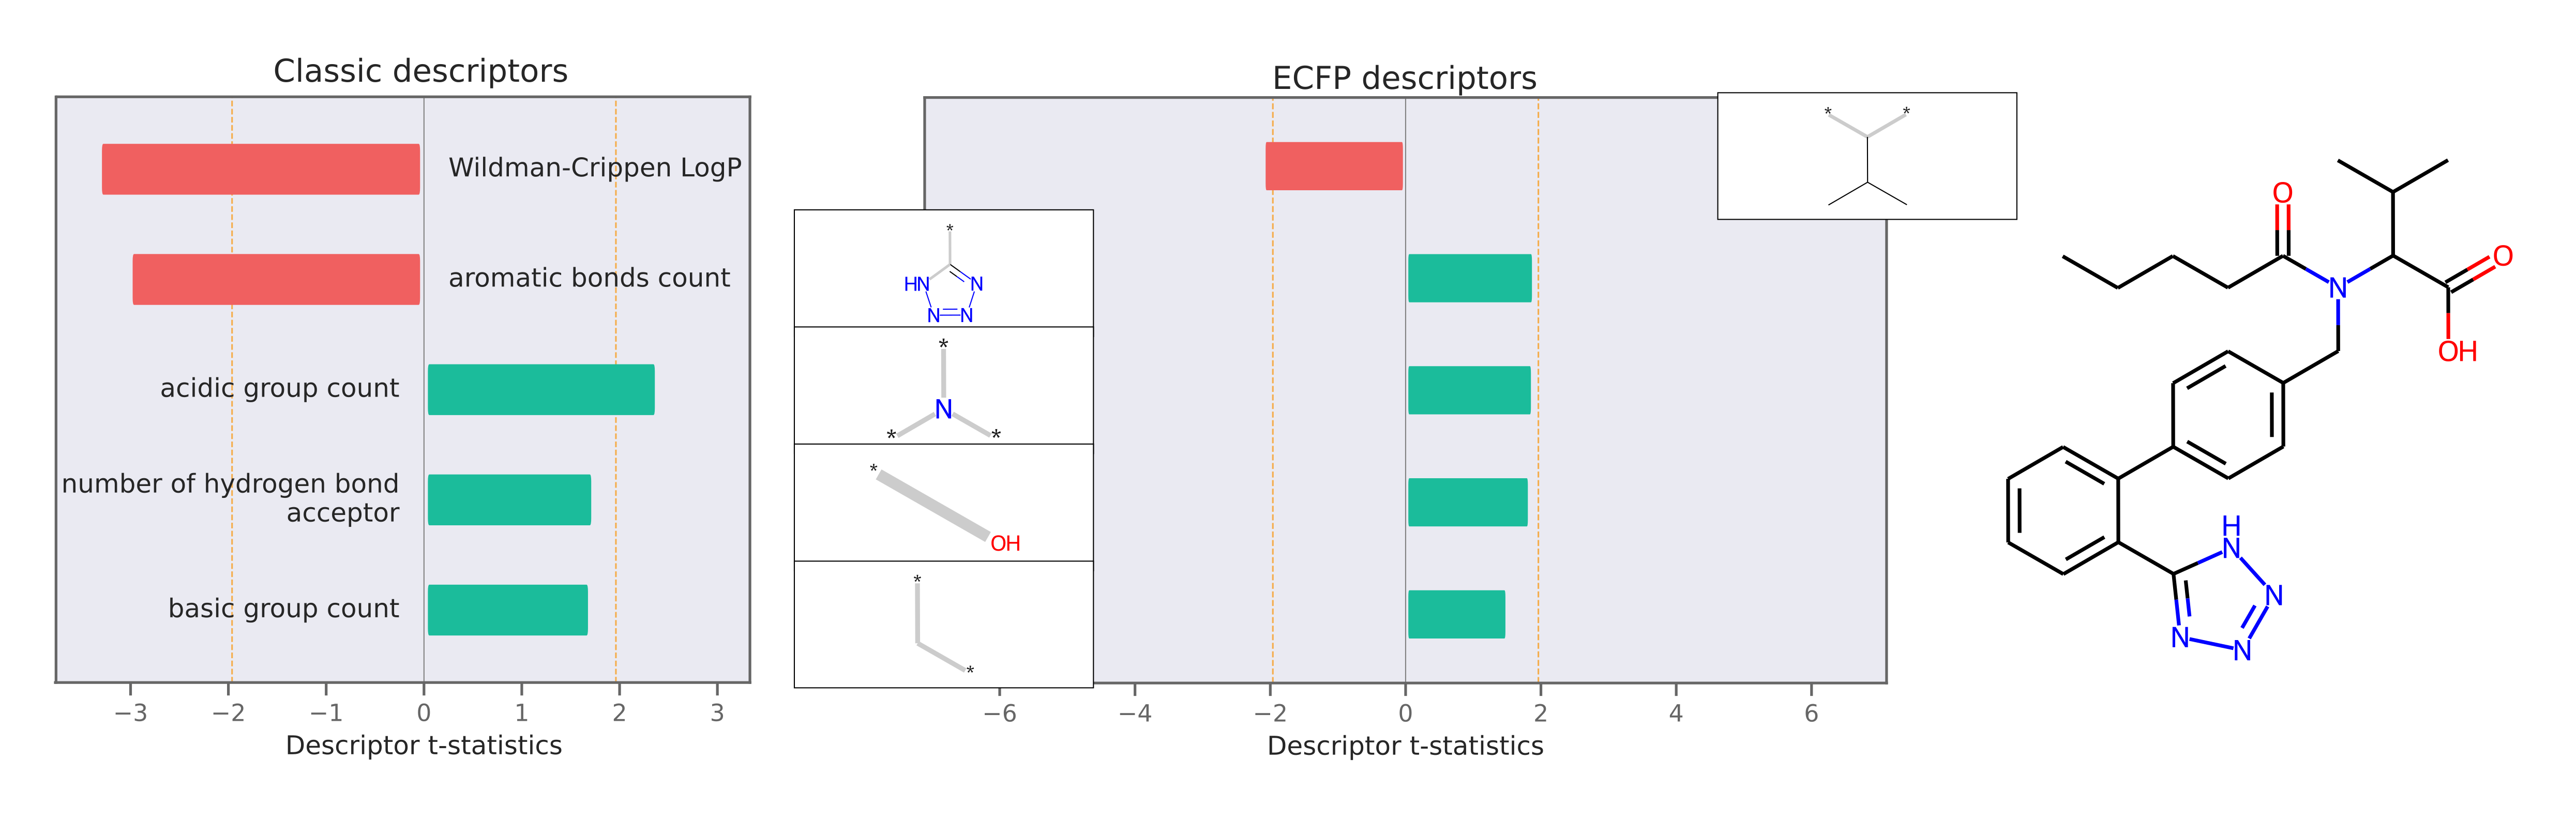 The descriptor t-statistics show which chemical properties or substructures influence properety prediction for the pictured molecule. LIME is a perturbation based method and the descriptor attributions depend on the perturbed chemical space created around the molecule of interest.
## Usage
Let's assume you have a deep learning model `my_model(s)` that takes in one SMILES string and outputs a predicted binary class. We first expand chemical space around the prediction of interest
```py
import exmol
# mol of interest
base = 'Cc1onc(-c2ccccc2Cl)c1C(=O)NC1C(=O)N2C1SC(C)(C)C2C(=O)O'
samples = exmol.sample_space(base, my_model, batched=False)
```
We uses `batched=False` to indicate `my_model` cannot handle a batch of SMILES, just one at a time. If your model takes SELFIES, just pass `use_selfies=True` to `sample_space`. Now we select counterfactuals from that space and plot them.
```py
cfs = exmol.cf_explain(samples)
exmol.plot_cf(cfs)
```
The descriptor t-statistics show which chemical properties or substructures influence properety prediction for the pictured molecule. LIME is a perturbation based method and the descriptor attributions depend on the perturbed chemical space created around the molecule of interest.
## Usage
Let's assume you have a deep learning model `my_model(s)` that takes in one SMILES string and outputs a predicted binary class. We first expand chemical space around the prediction of interest
```py
import exmol
# mol of interest
base = 'Cc1onc(-c2ccccc2Cl)c1C(=O)NC1C(=O)N2C1SC(C)(C)C2C(=O)O'
samples = exmol.sample_space(base, my_model, batched=False)
```
We uses `batched=False` to indicate `my_model` cannot handle a batch of SMILES, just one at a time. If your model takes SELFIES, just pass `use_selfies=True` to `sample_space`. Now we select counterfactuals from that space and plot them.
```py
cfs = exmol.cf_explain(samples)
exmol.plot_cf(cfs)
```
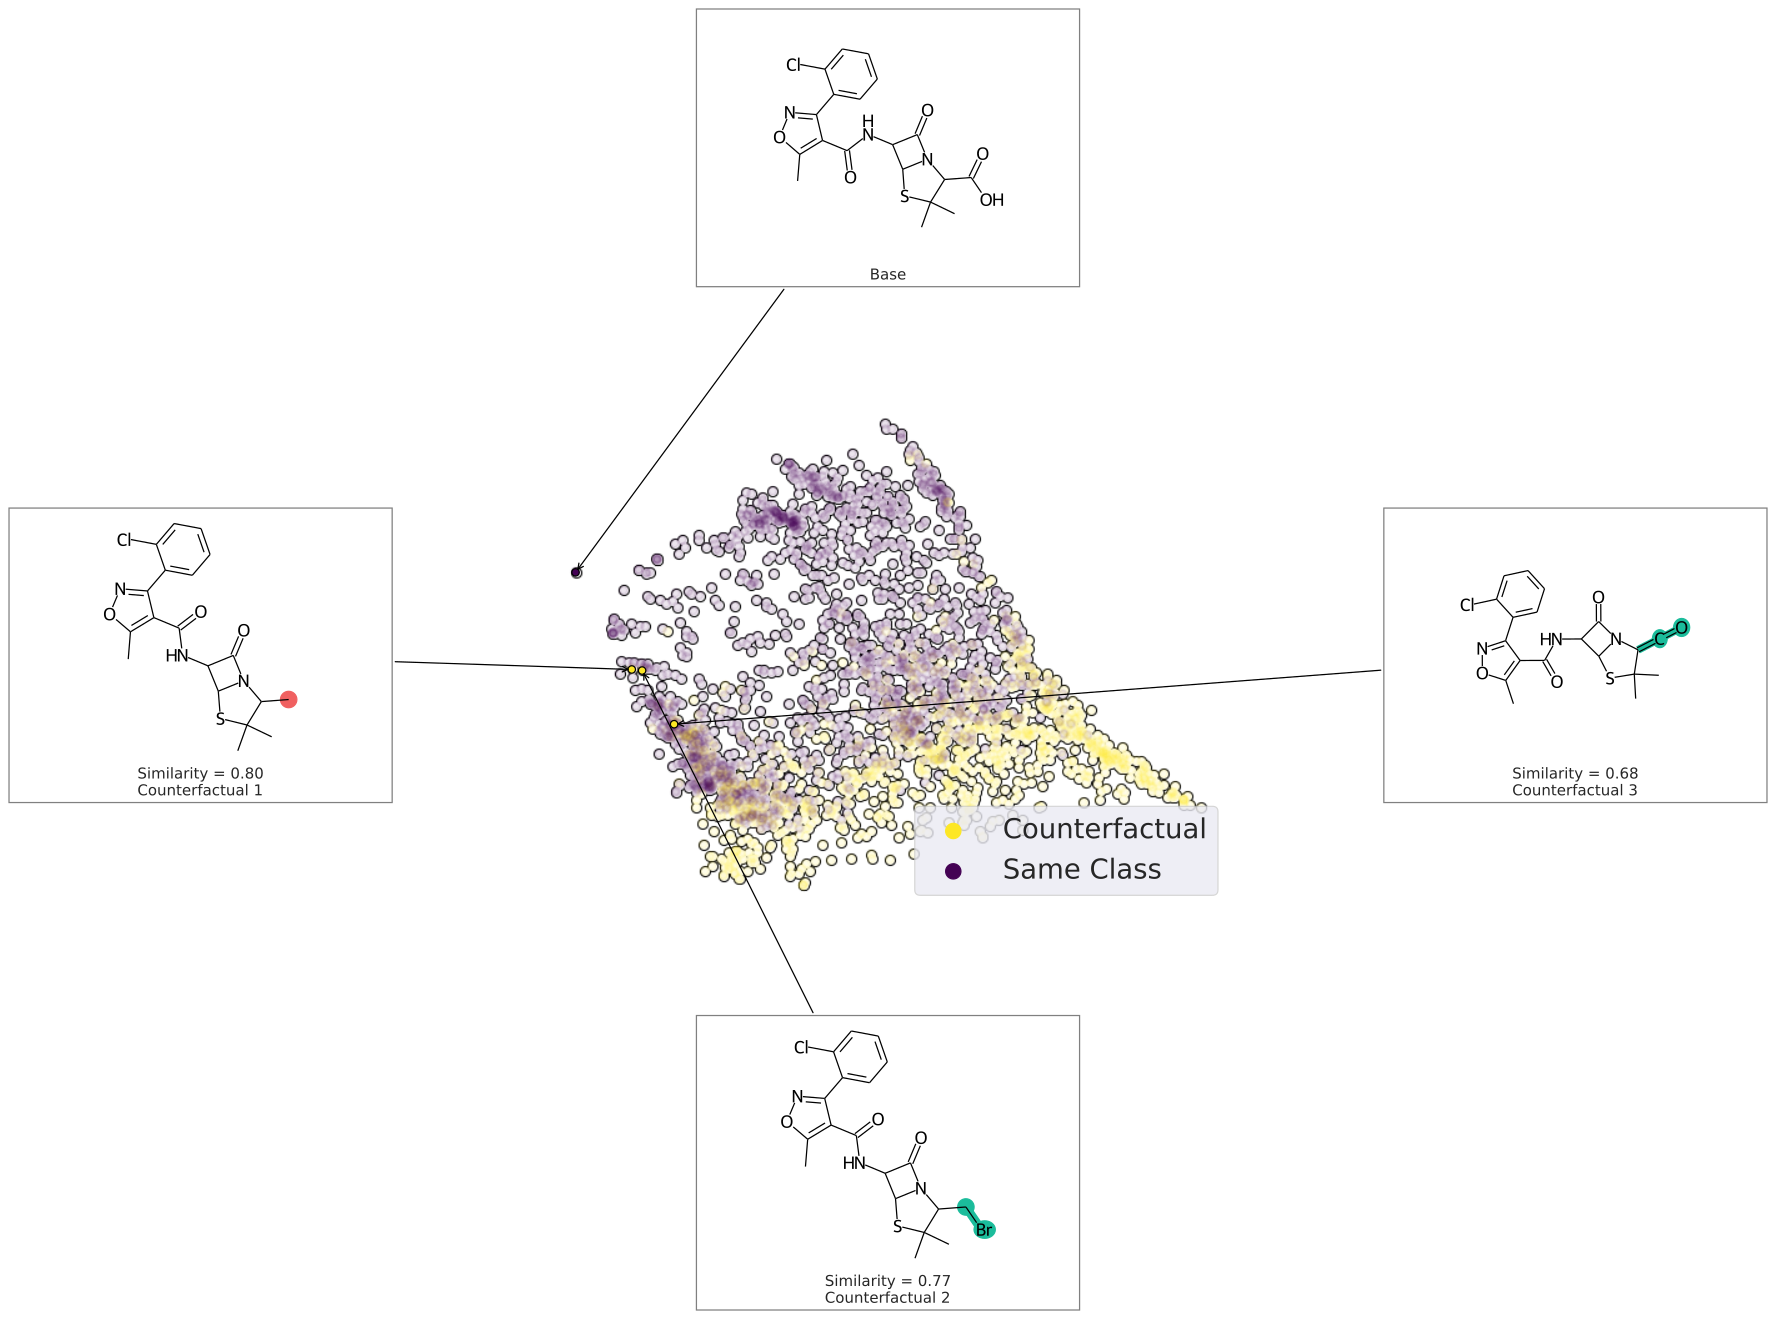
 We can also plot the space around the counterfactual. This is computed via PCA of the affinity matrix -- the similarity (Tanimoto of ECFP4) with the base molecule.
Due to how similarity is calculated, the base is going to be the farthest from all other molecules. Thus your base should fall on the left (or right) extreme of your plot.
```py
cfs = exmol.cf_explain(samples)
exmol.plot_space(samples, cfs)
```
We can also plot the space around the counterfactual. This is computed via PCA of the affinity matrix -- the similarity (Tanimoto of ECFP4) with the base molecule.
Due to how similarity is calculated, the base is going to be the farthest from all other molecules. Thus your base should fall on the left (or right) extreme of your plot.
```py
cfs = exmol.cf_explain(samples)
exmol.plot_space(samples, cfs)
```
 Each counterfactual is a Python `dataclass` with information allowing it to be used in your own analysis:
```py
print(cfs[1])
```
```
{
'smiles': 'Cc1onc(-c2ccccc2Cl)c1C(=O)NC1C(=O)N2C1SC(C)(C)C2C',
'selfies': '[C][C][O][N][=C][Branch1_1][Branch2_3][C][=C][C][=C][C][=C][Ring1][Branch1_2][Cl][C]
[Expl=Ring1][N][C][Branch1_2][C][=O][N][C][C][Branch1_2][C][=O][N][C][Ring1][Branch1_1][S][C]
[Branch1_1][C][C][Branch1_1][C][C][C][Ring1][Branch1_3][C]',
'similarity': 0.8,
'yhat': 1,
'index': 1813,
'position': array([-7.8032394 , 0.51781263]),
'is_origin': False,
'cluster': -1,
'label': 'Counterfactual 1'
}
```
We can use the same chemical space to get descriptor attributions for the molecule. Along with `samples`, we also need to specify the `descriptor_type` to get attributions. You can select from `Classic` Rdkit descriptors, `MACCS` fingerprint descriptors, `ECFP` substructure descriptors. The default `descriptor_type` is `MACCS`. If you'd like to use regression coefficients for analysis, specify `return_beta=True`. The descriptor t-statistics are stored in `descriptors.tstats` attribute for the base molecule and can be accessed using `space_tstats = space[0].descriptors.tstats`. `plot_descriptors` saves a plot as shown below in the `output_file`.
```py
beta = exmol.lime_explain(samples, descriptor_type='ECFP', return_beta=True)
exmol.plot_descriptors(samples, output_file='ecfp.svg')
```
Each counterfactual is a Python `dataclass` with information allowing it to be used in your own analysis:
```py
print(cfs[1])
```
```
{
'smiles': 'Cc1onc(-c2ccccc2Cl)c1C(=O)NC1C(=O)N2C1SC(C)(C)C2C',
'selfies': '[C][C][O][N][=C][Branch1_1][Branch2_3][C][=C][C][=C][C][=C][Ring1][Branch1_2][Cl][C]
[Expl=Ring1][N][C][Branch1_2][C][=O][N][C][C][Branch1_2][C][=O][N][C][Ring1][Branch1_1][S][C]
[Branch1_1][C][C][Branch1_1][C][C][C][Ring1][Branch1_3][C]',
'similarity': 0.8,
'yhat': 1,
'index': 1813,
'position': array([-7.8032394 , 0.51781263]),
'is_origin': False,
'cluster': -1,
'label': 'Counterfactual 1'
}
```
We can use the same chemical space to get descriptor attributions for the molecule. Along with `samples`, we also need to specify the `descriptor_type` to get attributions. You can select from `Classic` Rdkit descriptors, `MACCS` fingerprint descriptors, `ECFP` substructure descriptors. The default `descriptor_type` is `MACCS`. If you'd like to use regression coefficients for analysis, specify `return_beta=True`. The descriptor t-statistics are stored in `descriptors.tstats` attribute for the base molecule and can be accessed using `space_tstats = space[0].descriptors.tstats`. `plot_descriptors` saves a plot as shown below in the `output_file`.
```py
beta = exmol.lime_explain(samples, descriptor_type='ECFP', return_beta=True)
exmol.plot_descriptors(samples, output_file='ecfp.svg')
```
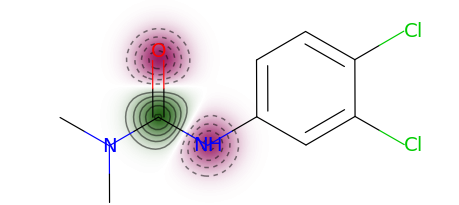
 You can use a more typical atom attribution plot as well, although note that some information is lost in this representation.
```py
exmol.plot_utils.similarity_map_using_tstats(samples[0])
```
You can use a more typical atom attribution plot as well, although note that some information is lost in this representation.
```py
exmol.plot_utils.similarity_map_using_tstats(samples[0])
```
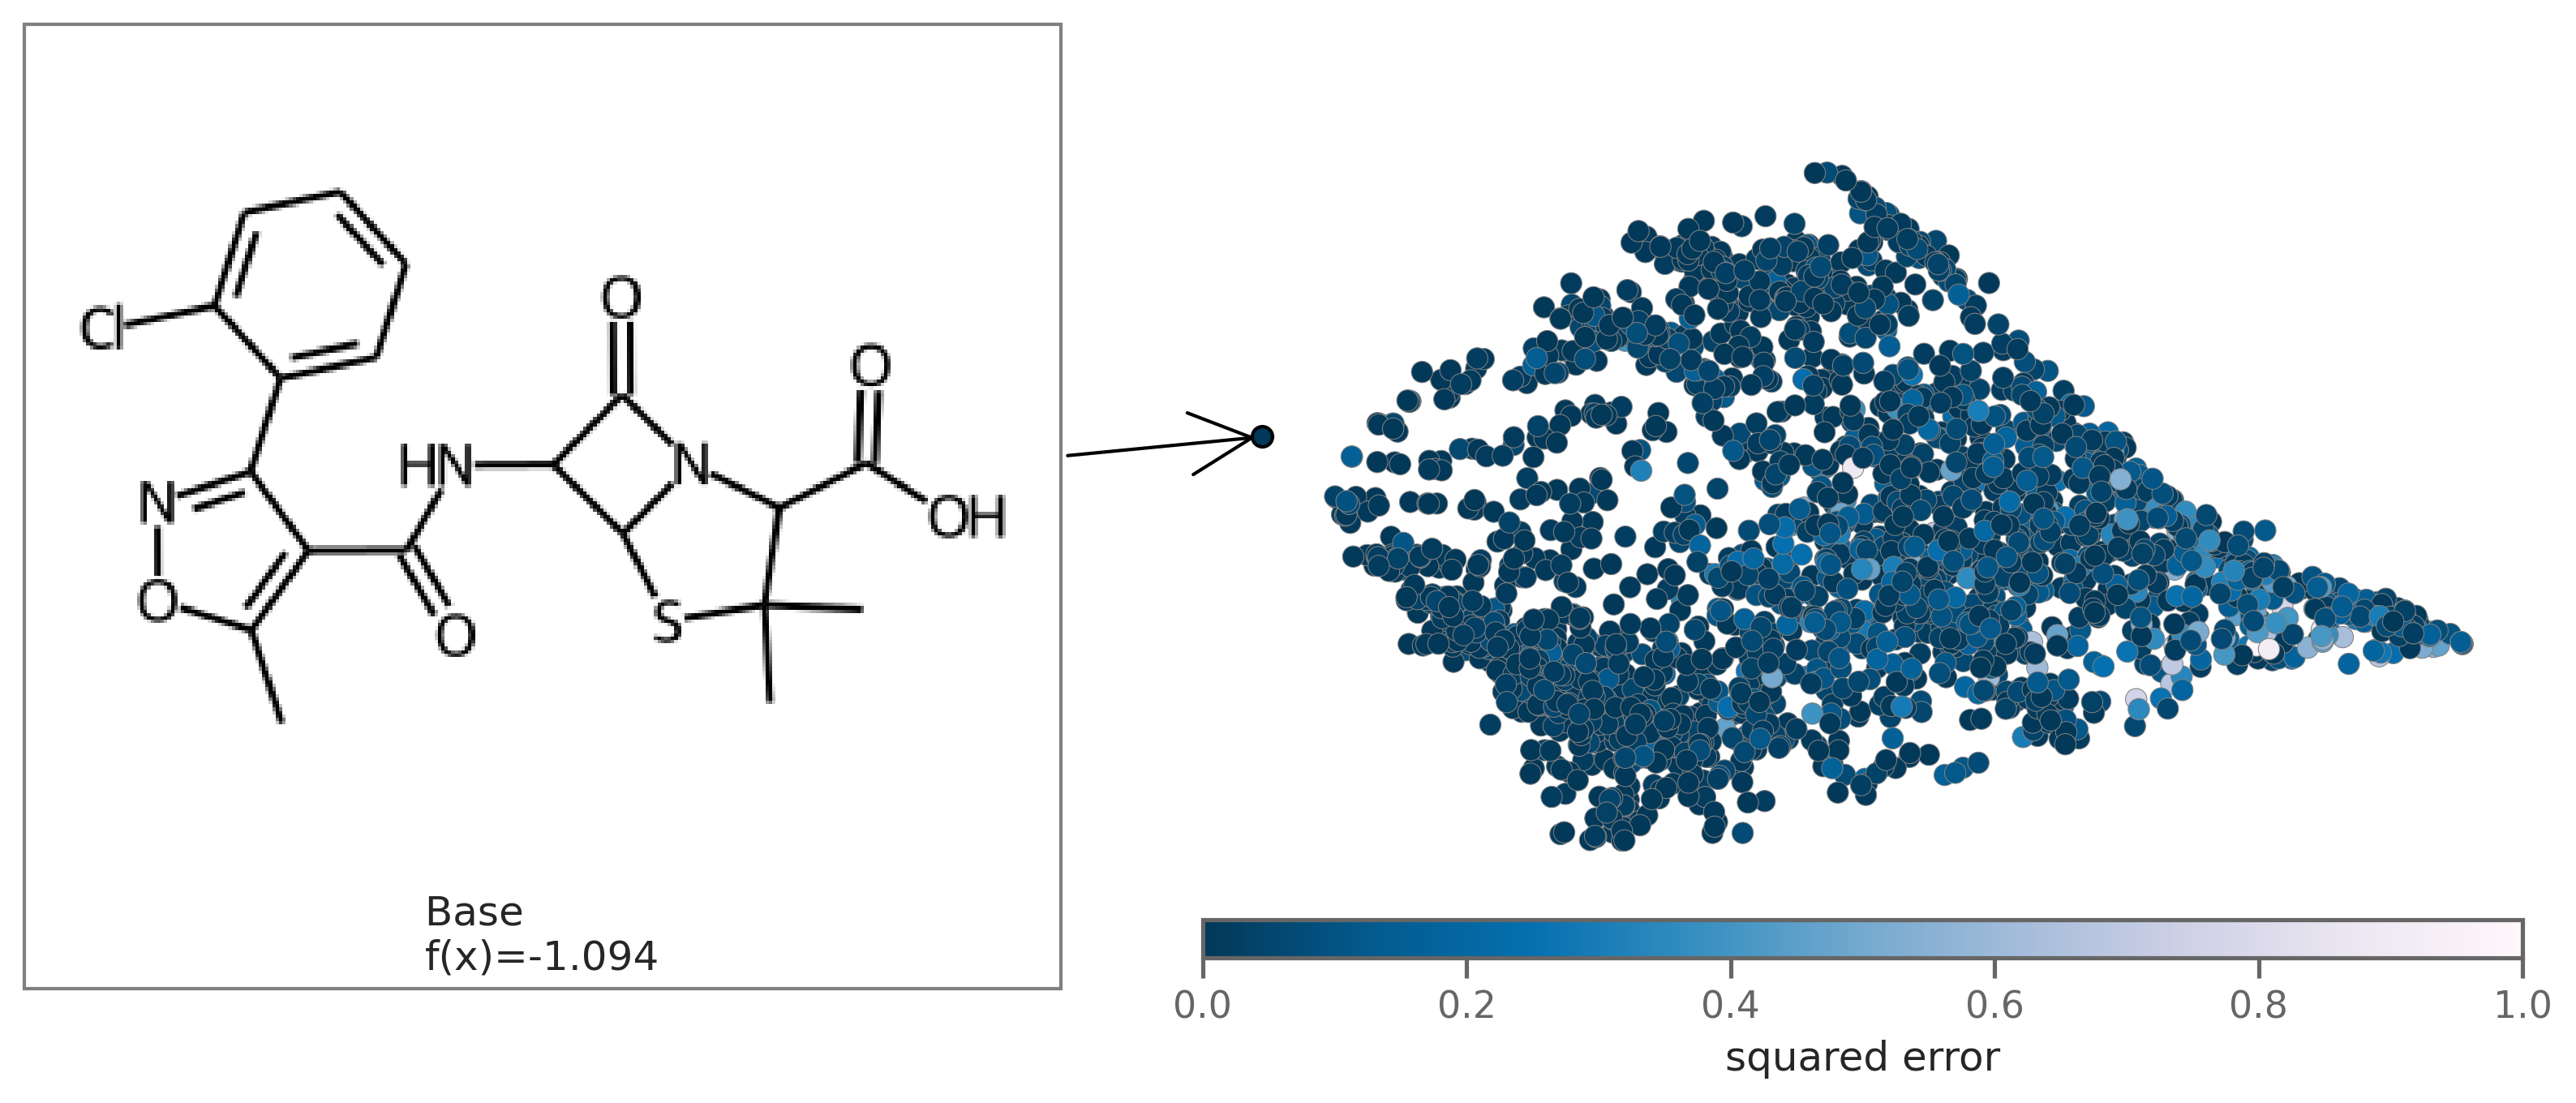
 You can also plot the chemical space colored by fit to see how well the regression fits the original model. To plot by fit, regression coefficients `beta` need to be passed in as an argument.
```py
exmol.plot_utils.plot_space_by_fit(
samples,
[samples[0]],
beta=beta,
mol_size=(300, 250),
figure_kwargs={'figsize': (7,5)},
)
```
You can also plot the chemical space colored by fit to see how well the regression fits the original model. To plot by fit, regression coefficients `beta` need to be passed in as an argument.
```py
exmol.plot_utils.plot_space_by_fit(
samples,
[samples[0]],
beta=beta,
mol_size=(300, 250),
figure_kwargs={'figsize': (7,5)},
)
```
 It is also possible to get global attributions for multiple base molecules. For this, the user should create a space around each instance of interest and concatenate these spaces. Then use this joint space to do lime explanations:
```py
beta = exmol.lime_explain(joint_space, descriptor_type='ECFP', return_beta=True, multiple_bases=True)
```
`lime_explain()` uses a linear surrogate model for descriptor explanations. You can also use a custom surrogate model instead of a linear model. To do so, just add desired descriptors to the chemical space using the `add_descriptors()` function and then use a custom model on samples to get explanations. For example, add ECFP descriptors using `exmol.add_descriptors(samples, descriptor_type='ECFP')`.
## Further Examples
You can find more examples by looking at the exact code used to generate all figures from our paper [in the docs webpage](https://ur-whitelab.github.io/exmol/toc.html).
## Chemical Space
When calling `exmol.sample_space` you can pass `preset=`, which can be
one of the following:
* `'narrow'`: Only one change to molecular structure, reduced set of possible bonds/elements
* `'medium'`: Default. One or two changes to molecular structure, reduced set of possible bonds/elements
* `'wide'`: One through five changes to molecular structure, large set of possible bonds/elements
* `'chemed'`: A restricted set where only pubchem molecules are considered.
* `'custom'`: A restricted set where only molecules provided by the "data" key are considered.
* `'synspace'`: Chemical space is generated by running retro and forward synthesis reactions, so all generaterd molecules are synthetically feasible. Uses [synspace](https://github.com/whitead/synspace) package.
You can also pass `num_samples` as a "request" for number of samples. You will typically end up with less due to
degenerate molecules. See API for complete description.
## SVG
Molecules are by default drawn as PNGs. If you would like to have them drawn as SVGs, call `insert_svg` after calling
`plot_space` or `plot_cf`
```py
import skunk
exmol.plot_cf(exps)
svg = exmol.insert_svg(exps, mol_fontsize=16)
# for Jupyter Notebook
skunk.display(svg)
# To save to file
with open('myplot.svg', 'w') as f:
f.write(svg)
```
This is done with the [skunk🦨 library](https://github.com/whitead/skunk).
## Disable Progress Bars
If `exmol` is being too loud, add `quiet = True` to `sample_space` arguments.
## API and Docs
[Read API here](https://ur-whitelab.github.io/exmol/api.html). You should also read the paper (see below) for a more exact
description of the methods and implementation.
## Developing
This repo uses pre-commit, so after cloning run `pip install -r requirements.txt` and `pre-commit install` prior to committing.
## Citation
For the counterfactual work, please cite [Wellawatte et al.](https://pubs.rsc.org/en/content/articlelanding/2022/sc/d1sc05259d#!divAbstract)
```bibtex
@Article{wellawatte_seshadri_white_2021,
author ="Wellawatte, Geemi P. and Seshadri, Aditi and White, Andrew D.",
title ="Model agnostic generation of counterfactual explanations for molecules",
journal ="Chem. Sci.",
year ="2022",
pages ="-",
publisher ="The Royal Society of Chemistry",
doi ="10.1039/D1SC05259D",
url ="http://dx.doi.org/10.1039/D1SC05259D",
}
```
For the descriptor explanations, please cite [Gandhi et. al.](https://doi.org/10.26434/chemrxiv-2022-v5p6m-v2)
```bibtex
@Article{gandhi_white_2022,
place = "Cambridge",
title = "Explaining structure-activity relationships using locally faithful surrogate models",
DOI = "10.26434/chemrxiv-2022-v5p6m",
url = "https://doi.org/10.26434/chemrxiv-2022-v5p6m"
journal = "ChemRxiv",
publisher = "Cambridge Open Engage",
author = "Gandhi, Heta A. and White, Andrew D.",
year = "2022"
}
```
%package -n python3-exmol
Summary: Counterfactual generation with STONED SELFIES
Provides: python-exmol
BuildRequires: python3-devel
BuildRequires: python3-setuptools
BuildRequires: python3-pip
%description -n python3-exmol
# Explaining why that molecule
[](https://github.com/ur-whitelab/exmol)
[](https://github.com/ur-whitelab/exmol) [](https://github.com/ur-whitelab/exmol) [](https://ur-whitelab.github.io/exmol/)
[](https://badge.fury.io/py/exmol)
[](https://lbesson.mit-license.org/)
- [Explaining why that molecule](#explaining-why-that-molecule)
- [Install](#install)
- [Quickstart](#quickstart)
- [Counterfactual Generation](#counterfactual-generation)
- [Descriptor Attribution](#descriptor-attribution)
- [Usage](#usage)
- [Further Examples](#further-examples)
- [Chemical Space](#chemical-space)
- [SVG](#svg)
- [Disable Progress Bars](#disable-progress-bars)
- [API and Docs](#api-and-docs)
- [Developing](#developing)
- [Citation](#citation)
`exmol` is a package to explain black-box predictions of molecules. The package uses model agnostic explanations to help users understand why a molecule is predicted to have a property.
## Install
```sh
pip install exmol
```
## Quickstart
See [the tutorial](https://ur-whitelab.github.io/exmol/paper2_LIME/Tutorial.html) to give an overview of the basic usage of exmol.
## Counterfactual Generation
Our package implements the Model Agnostic Counterfactual Compounds with STONED to generate counterfactuals.
A counterfactual can explain a prediction by showing what would have to change in the molecule to change its predicted class. Here is an example of a counterfactual:
> This package is not popular. If the package had a logo, it would be popular.
In addition to having a changed prediction, a molecular counterfactual must be similar to its base molecule as much as possible. Here is an example of a molecular counterfactual:
The counterfactual shows that if the carboxylic acid were an ester, the molecule would be active. It is up to the user to translate this set of structures into a meaningful sentence.
## Descriptor Attribution
This package also implements Model Agnostic Descriptor Attribution for molecules using LIME.
Descriptor attributions can explain a prediction by computing QSARs for molecular structure properties independent of features used for model predictions. Here is an example of descriptor attribution:
The descriptor t-statistics show which chemical properties or substructures influence properety prediction for the pictured molecule. LIME is a perturbation based method and the descriptor attributions depend on the perturbed chemical space created around the molecule of interest.
## Usage
Let's assume you have a deep learning model `my_model(s)` that takes in one SMILES string and outputs a predicted binary class. We first expand chemical space around the prediction of interest
```py
import exmol
# mol of interest
base = 'Cc1onc(-c2ccccc2Cl)c1C(=O)NC1C(=O)N2C1SC(C)(C)C2C(=O)O'
samples = exmol.sample_space(base, my_model, batched=False)
```
We uses `batched=False` to indicate `my_model` cannot handle a batch of SMILES, just one at a time. If your model takes SELFIES, just pass `use_selfies=True` to `sample_space`. Now we select counterfactuals from that space and plot them.
```py
cfs = exmol.cf_explain(samples)
exmol.plot_cf(cfs)
```
We can also plot the space around the counterfactual. This is computed via PCA of the affinity matrix -- the similarity (Tanimoto of ECFP4) with the base molecule.
Due to how similarity is calculated, the base is going to be the farthest from all other molecules. Thus your base should fall on the left (or right) extreme of your plot.
```py
cfs = exmol.cf_explain(samples)
exmol.plot_space(samples, cfs)
```
Each counterfactual is a Python `dataclass` with information allowing it to be used in your own analysis:
```py
print(cfs[1])
```
```
{
'smiles': 'Cc1onc(-c2ccccc2Cl)c1C(=O)NC1C(=O)N2C1SC(C)(C)C2C',
'selfies': '[C][C][O][N][=C][Branch1_1][Branch2_3][C][=C][C][=C][C][=C][Ring1][Branch1_2][Cl][C]
[Expl=Ring1][N][C][Branch1_2][C][=O][N][C][C][Branch1_2][C][=O][N][C][Ring1][Branch1_1][S][C]
[Branch1_1][C][C][Branch1_1][C][C][C][Ring1][Branch1_3][C]',
'similarity': 0.8,
'yhat': 1,
'index': 1813,
'position': array([-7.8032394 , 0.51781263]),
'is_origin': False,
'cluster': -1,
'label': 'Counterfactual 1'
}
```
We can use the same chemical space to get descriptor attributions for the molecule. Along with `samples`, we also need to specify the `descriptor_type` to get attributions. You can select from `Classic` Rdkit descriptors, `MACCS` fingerprint descriptors, `ECFP` substructure descriptors. The default `descriptor_type` is `MACCS`. If you'd like to use regression coefficients for analysis, specify `return_beta=True`. The descriptor t-statistics are stored in `descriptors.tstats` attribute for the base molecule and can be accessed using `space_tstats = space[0].descriptors.tstats`. `plot_descriptors` saves a plot as shown below in the `output_file`.
```py
beta = exmol.lime_explain(samples, descriptor_type='ECFP', return_beta=True)
exmol.plot_descriptors(samples, output_file='ecfp.svg')
```
You can use a more typical atom attribution plot as well, although note that some information is lost in this representation.
```py
exmol.plot_utils.similarity_map_using_tstats(samples[0])
```
You can also plot the chemical space colored by fit to see how well the regression fits the original model. To plot by fit, regression coefficients `beta` need to be passed in as an argument.
```py
exmol.plot_utils.plot_space_by_fit(
samples,
[samples[0]],
beta=beta,
mol_size=(300, 250),
figure_kwargs={'figsize': (7,5)},
)
```
It is also possible to get global attributions for multiple base molecules. For this, the user should create a space around each instance of interest and concatenate these spaces. Then use this joint space to do lime explanations:
```py
beta = exmol.lime_explain(joint_space, descriptor_type='ECFP', return_beta=True, multiple_bases=True)
```
`lime_explain()` uses a linear surrogate model for descriptor explanations. You can also use a custom surrogate model instead of a linear model. To do so, just add desired descriptors to the chemical space using the `add_descriptors()` function and then use a custom model on samples to get explanations. For example, add ECFP descriptors using `exmol.add_descriptors(samples, descriptor_type='ECFP')`.
## Further Examples
You can find more examples by looking at the exact code used to generate all figures from our paper [in the docs webpage](https://ur-whitelab.github.io/exmol/toc.html).
## Chemical Space
When calling `exmol.sample_space` you can pass `preset=`, which can be
one of the following:
* `'narrow'`: Only one change to molecular structure, reduced set of possible bonds/elements
* `'medium'`: Default. One or two changes to molecular structure, reduced set of possible bonds/elements
* `'wide'`: One through five changes to molecular structure, large set of possible bonds/elements
* `'chemed'`: A restricted set where only pubchem molecules are considered.
* `'custom'`: A restricted set where only molecules provided by the "data" key are considered.
* `'synspace'`: Chemical space is generated by running retro and forward synthesis reactions, so all generaterd molecules are synthetically feasible. Uses [synspace](https://github.com/whitead/synspace) package.
You can also pass `num_samples` as a "request" for number of samples. You will typically end up with less due to
degenerate molecules. See API for complete description.
## SVG
Molecules are by default drawn as PNGs. If you would like to have them drawn as SVGs, call `insert_svg` after calling
`plot_space` or `plot_cf`
```py
import skunk
exmol.plot_cf(exps)
svg = exmol.insert_svg(exps, mol_fontsize=16)
# for Jupyter Notebook
skunk.display(svg)
# To save to file
with open('myplot.svg', 'w') as f:
f.write(svg)
```
This is done with the [skunk🦨 library](https://github.com/whitead/skunk).
## Disable Progress Bars
If `exmol` is being too loud, add `quiet = True` to `sample_space` arguments.
## API and Docs
[Read API here](https://ur-whitelab.github.io/exmol/api.html). You should also read the paper (see below) for a more exact
description of the methods and implementation.
## Developing
This repo uses pre-commit, so after cloning run `pip install -r requirements.txt` and `pre-commit install` prior to committing.
## Citation
For the counterfactual work, please cite [Wellawatte et al.](https://pubs.rsc.org/en/content/articlelanding/2022/sc/d1sc05259d#!divAbstract)
```bibtex
@Article{wellawatte_seshadri_white_2021,
author ="Wellawatte, Geemi P. and Seshadri, Aditi and White, Andrew D.",
title ="Model agnostic generation of counterfactual explanations for molecules",
journal ="Chem. Sci.",
year ="2022",
pages ="-",
publisher ="The Royal Society of Chemistry",
doi ="10.1039/D1SC05259D",
url ="http://dx.doi.org/10.1039/D1SC05259D",
}
```
For the descriptor explanations, please cite [Gandhi et. al.](https://doi.org/10.26434/chemrxiv-2022-v5p6m-v2)
```bibtex
@Article{gandhi_white_2022,
place = "Cambridge",
title = "Explaining structure-activity relationships using locally faithful surrogate models",
DOI = "10.26434/chemrxiv-2022-v5p6m",
url = "https://doi.org/10.26434/chemrxiv-2022-v5p6m"
journal = "ChemRxiv",
publisher = "Cambridge Open Engage",
author = "Gandhi, Heta A. and White, Andrew D.",
year = "2022"
}
```
%package help
Summary: Development documents and examples for exmol
Provides: python3-exmol-doc
%description help
# Explaining why that molecule
[](https://github.com/ur-whitelab/exmol)
[](https://github.com/ur-whitelab/exmol) [](https://github.com/ur-whitelab/exmol) [](https://ur-whitelab.github.io/exmol/)
[](https://badge.fury.io/py/exmol)
[](https://lbesson.mit-license.org/)
- [Explaining why that molecule](#explaining-why-that-molecule)
- [Install](#install)
- [Quickstart](#quickstart)
- [Counterfactual Generation](#counterfactual-generation)
- [Descriptor Attribution](#descriptor-attribution)
- [Usage](#usage)
- [Further Examples](#further-examples)
- [Chemical Space](#chemical-space)
- [SVG](#svg)
- [Disable Progress Bars](#disable-progress-bars)
- [API and Docs](#api-and-docs)
- [Developing](#developing)
- [Citation](#citation)
`exmol` is a package to explain black-box predictions of molecules. The package uses model agnostic explanations to help users understand why a molecule is predicted to have a property.
## Install
```sh
pip install exmol
```
## Quickstart
See [the tutorial](https://ur-whitelab.github.io/exmol/paper2_LIME/Tutorial.html) to give an overview of the basic usage of exmol.
## Counterfactual Generation
Our package implements the Model Agnostic Counterfactual Compounds with STONED to generate counterfactuals.
A counterfactual can explain a prediction by showing what would have to change in the molecule to change its predicted class. Here is an example of a counterfactual:
> This package is not popular. If the package had a logo, it would be popular.
In addition to having a changed prediction, a molecular counterfactual must be similar to its base molecule as much as possible. Here is an example of a molecular counterfactual:
The counterfactual shows that if the carboxylic acid were an ester, the molecule would be active. It is up to the user to translate this set of structures into a meaningful sentence.
## Descriptor Attribution
This package also implements Model Agnostic Descriptor Attribution for molecules using LIME.
Descriptor attributions can explain a prediction by computing QSARs for molecular structure properties independent of features used for model predictions. Here is an example of descriptor attribution:
The descriptor t-statistics show which chemical properties or substructures influence properety prediction for the pictured molecule. LIME is a perturbation based method and the descriptor attributions depend on the perturbed chemical space created around the molecule of interest.
## Usage
Let's assume you have a deep learning model `my_model(s)` that takes in one SMILES string and outputs a predicted binary class. We first expand chemical space around the prediction of interest
```py
import exmol
# mol of interest
base = 'Cc1onc(-c2ccccc2Cl)c1C(=O)NC1C(=O)N2C1SC(C)(C)C2C(=O)O'
samples = exmol.sample_space(base, my_model, batched=False)
```
We uses `batched=False` to indicate `my_model` cannot handle a batch of SMILES, just one at a time. If your model takes SELFIES, just pass `use_selfies=True` to `sample_space`. Now we select counterfactuals from that space and plot them.
```py
cfs = exmol.cf_explain(samples)
exmol.plot_cf(cfs)
```
We can also plot the space around the counterfactual. This is computed via PCA of the affinity matrix -- the similarity (Tanimoto of ECFP4) with the base molecule.
Due to how similarity is calculated, the base is going to be the farthest from all other molecules. Thus your base should fall on the left (or right) extreme of your plot.
```py
cfs = exmol.cf_explain(samples)
exmol.plot_space(samples, cfs)
```
Each counterfactual is a Python `dataclass` with information allowing it to be used in your own analysis:
```py
print(cfs[1])
```
```
{
'smiles': 'Cc1onc(-c2ccccc2Cl)c1C(=O)NC1C(=O)N2C1SC(C)(C)C2C',
'selfies': '[C][C][O][N][=C][Branch1_1][Branch2_3][C][=C][C][=C][C][=C][Ring1][Branch1_2][Cl][C]
[Expl=Ring1][N][C][Branch1_2][C][=O][N][C][C][Branch1_2][C][=O][N][C][Ring1][Branch1_1][S][C]
[Branch1_1][C][C][Branch1_1][C][C][C][Ring1][Branch1_3][C]',
'similarity': 0.8,
'yhat': 1,
'index': 1813,
'position': array([-7.8032394 , 0.51781263]),
'is_origin': False,
'cluster': -1,
'label': 'Counterfactual 1'
}
```
We can use the same chemical space to get descriptor attributions for the molecule. Along with `samples`, we also need to specify the `descriptor_type` to get attributions. You can select from `Classic` Rdkit descriptors, `MACCS` fingerprint descriptors, `ECFP` substructure descriptors. The default `descriptor_type` is `MACCS`. If you'd like to use regression coefficients for analysis, specify `return_beta=True`. The descriptor t-statistics are stored in `descriptors.tstats` attribute for the base molecule and can be accessed using `space_tstats = space[0].descriptors.tstats`. `plot_descriptors` saves a plot as shown below in the `output_file`.
```py
beta = exmol.lime_explain(samples, descriptor_type='ECFP', return_beta=True)
exmol.plot_descriptors(samples, output_file='ecfp.svg')
```
You can use a more typical atom attribution plot as well, although note that some information is lost in this representation.
```py
exmol.plot_utils.similarity_map_using_tstats(samples[0])
```
You can also plot the chemical space colored by fit to see how well the regression fits the original model. To plot by fit, regression coefficients `beta` need to be passed in as an argument.
```py
exmol.plot_utils.plot_space_by_fit(
samples,
[samples[0]],
beta=beta,
mol_size=(300, 250),
figure_kwargs={'figsize': (7,5)},
)
```
It is also possible to get global attributions for multiple base molecules. For this, the user should create a space around each instance of interest and concatenate these spaces. Then use this joint space to do lime explanations:
```py
beta = exmol.lime_explain(joint_space, descriptor_type='ECFP', return_beta=True, multiple_bases=True)
```
`lime_explain()` uses a linear surrogate model for descriptor explanations. You can also use a custom surrogate model instead of a linear model. To do so, just add desired descriptors to the chemical space using the `add_descriptors()` function and then use a custom model on samples to get explanations. For example, add ECFP descriptors using `exmol.add_descriptors(samples, descriptor_type='ECFP')`.
## Further Examples
You can find more examples by looking at the exact code used to generate all figures from our paper [in the docs webpage](https://ur-whitelab.github.io/exmol/toc.html).
## Chemical Space
When calling `exmol.sample_space` you can pass `preset=`, which can be
one of the following:
* `'narrow'`: Only one change to molecular structure, reduced set of possible bonds/elements
* `'medium'`: Default. One or two changes to molecular structure, reduced set of possible bonds/elements
* `'wide'`: One through five changes to molecular structure, large set of possible bonds/elements
* `'chemed'`: A restricted set where only pubchem molecules are considered.
* `'custom'`: A restricted set where only molecules provided by the "data" key are considered.
* `'synspace'`: Chemical space is generated by running retro and forward synthesis reactions, so all generaterd molecules are synthetically feasible. Uses [synspace](https://github.com/whitead/synspace) package.
You can also pass `num_samples` as a "request" for number of samples. You will typically end up with less due to
degenerate molecules. See API for complete description.
## SVG
Molecules are by default drawn as PNGs. If you would like to have them drawn as SVGs, call `insert_svg` after calling
`plot_space` or `plot_cf`
```py
import skunk
exmol.plot_cf(exps)
svg = exmol.insert_svg(exps, mol_fontsize=16)
# for Jupyter Notebook
skunk.display(svg)
# To save to file
with open('myplot.svg', 'w') as f:
f.write(svg)
```
This is done with the [skunk🦨 library](https://github.com/whitead/skunk).
## Disable Progress Bars
If `exmol` is being too loud, add `quiet = True` to `sample_space` arguments.
## API and Docs
[Read API here](https://ur-whitelab.github.io/exmol/api.html). You should also read the paper (see below) for a more exact
description of the methods and implementation.
## Developing
This repo uses pre-commit, so after cloning run `pip install -r requirements.txt` and `pre-commit install` prior to committing.
## Citation
For the counterfactual work, please cite [Wellawatte et al.](https://pubs.rsc.org/en/content/articlelanding/2022/sc/d1sc05259d#!divAbstract)
```bibtex
@Article{wellawatte_seshadri_white_2021,
author ="Wellawatte, Geemi P. and Seshadri, Aditi and White, Andrew D.",
title ="Model agnostic generation of counterfactual explanations for molecules",
journal ="Chem. Sci.",
year ="2022",
pages ="-",
publisher ="The Royal Society of Chemistry",
doi ="10.1039/D1SC05259D",
url ="http://dx.doi.org/10.1039/D1SC05259D",
}
```
For the descriptor explanations, please cite [Gandhi et. al.](https://doi.org/10.26434/chemrxiv-2022-v5p6m-v2)
```bibtex
@Article{gandhi_white_2022,
place = "Cambridge",
title = "Explaining structure-activity relationships using locally faithful surrogate models",
DOI = "10.26434/chemrxiv-2022-v5p6m",
url = "https://doi.org/10.26434/chemrxiv-2022-v5p6m"
journal = "ChemRxiv",
publisher = "Cambridge Open Engage",
author = "Gandhi, Heta A. and White, Andrew D.",
year = "2022"
}
```
%prep
%autosetup -n exmol-3.0.3
%build
%py3_build
%install
%py3_install
install -d -m755 %{buildroot}/%{_pkgdocdir}
if [ -d doc ]; then cp -arf doc %{buildroot}/%{_pkgdocdir}; fi
if [ -d docs ]; then cp -arf docs %{buildroot}/%{_pkgdocdir}; fi
if [ -d example ]; then cp -arf example %{buildroot}/%{_pkgdocdir}; fi
if [ -d examples ]; then cp -arf examples %{buildroot}/%{_pkgdocdir}; fi
pushd %{buildroot}
if [ -d usr/lib ]; then
find usr/lib -type f -printf "\"/%h/%f\"\n" >> filelist.lst
fi
if [ -d usr/lib64 ]; then
find usr/lib64 -type f -printf "\"/%h/%f\"\n" >> filelist.lst
fi
if [ -d usr/bin ]; then
find usr/bin -type f -printf "\"/%h/%f\"\n" >> filelist.lst
fi
if [ -d usr/sbin ]; then
find usr/sbin -type f -printf "\"/%h/%f\"\n" >> filelist.lst
fi
touch doclist.lst
if [ -d usr/share/man ]; then
find usr/share/man -type f -printf "\"/%h/%f.gz\"\n" >> doclist.lst
fi
popd
mv %{buildroot}/filelist.lst .
mv %{buildroot}/doclist.lst .
%files -n python3-exmol -f filelist.lst
%dir %{python3_sitelib}/*
%files help -f doclist.lst
%{_docdir}/*
%changelog
* Tue Jun 20 2023 Python_Bot - 3.0.3-1
- Package Spec generated
It is also possible to get global attributions for multiple base molecules. For this, the user should create a space around each instance of interest and concatenate these spaces. Then use this joint space to do lime explanations:
```py
beta = exmol.lime_explain(joint_space, descriptor_type='ECFP', return_beta=True, multiple_bases=True)
```
`lime_explain()` uses a linear surrogate model for descriptor explanations. You can also use a custom surrogate model instead of a linear model. To do so, just add desired descriptors to the chemical space using the `add_descriptors()` function and then use a custom model on samples to get explanations. For example, add ECFP descriptors using `exmol.add_descriptors(samples, descriptor_type='ECFP')`.
## Further Examples
You can find more examples by looking at the exact code used to generate all figures from our paper [in the docs webpage](https://ur-whitelab.github.io/exmol/toc.html).
## Chemical Space
When calling `exmol.sample_space` you can pass `preset=`, which can be
one of the following:
* `'narrow'`: Only one change to molecular structure, reduced set of possible bonds/elements
* `'medium'`: Default. One or two changes to molecular structure, reduced set of possible bonds/elements
* `'wide'`: One through five changes to molecular structure, large set of possible bonds/elements
* `'chemed'`: A restricted set where only pubchem molecules are considered.
* `'custom'`: A restricted set where only molecules provided by the "data" key are considered.
* `'synspace'`: Chemical space is generated by running retro and forward synthesis reactions, so all generaterd molecules are synthetically feasible. Uses [synspace](https://github.com/whitead/synspace) package.
You can also pass `num_samples` as a "request" for number of samples. You will typically end up with less due to
degenerate molecules. See API for complete description.
## SVG
Molecules are by default drawn as PNGs. If you would like to have them drawn as SVGs, call `insert_svg` after calling
`plot_space` or `plot_cf`
```py
import skunk
exmol.plot_cf(exps)
svg = exmol.insert_svg(exps, mol_fontsize=16)
# for Jupyter Notebook
skunk.display(svg)
# To save to file
with open('myplot.svg', 'w') as f:
f.write(svg)
```
This is done with the [skunk🦨 library](https://github.com/whitead/skunk).
## Disable Progress Bars
If `exmol` is being too loud, add `quiet = True` to `sample_space` arguments.
## API and Docs
[Read API here](https://ur-whitelab.github.io/exmol/api.html). You should also read the paper (see below) for a more exact
description of the methods and implementation.
## Developing
This repo uses pre-commit, so after cloning run `pip install -r requirements.txt` and `pre-commit install` prior to committing.
## Citation
For the counterfactual work, please cite [Wellawatte et al.](https://pubs.rsc.org/en/content/articlelanding/2022/sc/d1sc05259d#!divAbstract)
```bibtex
@Article{wellawatte_seshadri_white_2021,
author ="Wellawatte, Geemi P. and Seshadri, Aditi and White, Andrew D.",
title ="Model agnostic generation of counterfactual explanations for molecules",
journal ="Chem. Sci.",
year ="2022",
pages ="-",
publisher ="The Royal Society of Chemistry",
doi ="10.1039/D1SC05259D",
url ="http://dx.doi.org/10.1039/D1SC05259D",
}
```
For the descriptor explanations, please cite [Gandhi et. al.](https://doi.org/10.26434/chemrxiv-2022-v5p6m-v2)
```bibtex
@Article{gandhi_white_2022,
place = "Cambridge",
title = "Explaining structure-activity relationships using locally faithful surrogate models",
DOI = "10.26434/chemrxiv-2022-v5p6m",
url = "https://doi.org/10.26434/chemrxiv-2022-v5p6m"
journal = "ChemRxiv",
publisher = "Cambridge Open Engage",
author = "Gandhi, Heta A. and White, Andrew D.",
year = "2022"
}
```
%package -n python3-exmol
Summary: Counterfactual generation with STONED SELFIES
Provides: python-exmol
BuildRequires: python3-devel
BuildRequires: python3-setuptools
BuildRequires: python3-pip
%description -n python3-exmol
# Explaining why that molecule
[](https://github.com/ur-whitelab/exmol)
[](https://github.com/ur-whitelab/exmol) [](https://github.com/ur-whitelab/exmol) [](https://ur-whitelab.github.io/exmol/)
[](https://badge.fury.io/py/exmol)
[](https://lbesson.mit-license.org/)
- [Explaining why that molecule](#explaining-why-that-molecule)
- [Install](#install)
- [Quickstart](#quickstart)
- [Counterfactual Generation](#counterfactual-generation)
- [Descriptor Attribution](#descriptor-attribution)
- [Usage](#usage)
- [Further Examples](#further-examples)
- [Chemical Space](#chemical-space)
- [SVG](#svg)
- [Disable Progress Bars](#disable-progress-bars)
- [API and Docs](#api-and-docs)
- [Developing](#developing)
- [Citation](#citation)
`exmol` is a package to explain black-box predictions of molecules. The package uses model agnostic explanations to help users understand why a molecule is predicted to have a property.
## Install
```sh
pip install exmol
```
## Quickstart
See [the tutorial](https://ur-whitelab.github.io/exmol/paper2_LIME/Tutorial.html) to give an overview of the basic usage of exmol.
## Counterfactual Generation
Our package implements the Model Agnostic Counterfactual Compounds with STONED to generate counterfactuals.
A counterfactual can explain a prediction by showing what would have to change in the molecule to change its predicted class. Here is an example of a counterfactual:
> This package is not popular. If the package had a logo, it would be popular.
In addition to having a changed prediction, a molecular counterfactual must be similar to its base molecule as much as possible. Here is an example of a molecular counterfactual:
The counterfactual shows that if the carboxylic acid were an ester, the molecule would be active. It is up to the user to translate this set of structures into a meaningful sentence.
## Descriptor Attribution
This package also implements Model Agnostic Descriptor Attribution for molecules using LIME.
Descriptor attributions can explain a prediction by computing QSARs for molecular structure properties independent of features used for model predictions. Here is an example of descriptor attribution:
The descriptor t-statistics show which chemical properties or substructures influence properety prediction for the pictured molecule. LIME is a perturbation based method and the descriptor attributions depend on the perturbed chemical space created around the molecule of interest.
## Usage
Let's assume you have a deep learning model `my_model(s)` that takes in one SMILES string and outputs a predicted binary class. We first expand chemical space around the prediction of interest
```py
import exmol
# mol of interest
base = 'Cc1onc(-c2ccccc2Cl)c1C(=O)NC1C(=O)N2C1SC(C)(C)C2C(=O)O'
samples = exmol.sample_space(base, my_model, batched=False)
```
We uses `batched=False` to indicate `my_model` cannot handle a batch of SMILES, just one at a time. If your model takes SELFIES, just pass `use_selfies=True` to `sample_space`. Now we select counterfactuals from that space and plot them.
```py
cfs = exmol.cf_explain(samples)
exmol.plot_cf(cfs)
```
We can also plot the space around the counterfactual. This is computed via PCA of the affinity matrix -- the similarity (Tanimoto of ECFP4) with the base molecule.
Due to how similarity is calculated, the base is going to be the farthest from all other molecules. Thus your base should fall on the left (or right) extreme of your plot.
```py
cfs = exmol.cf_explain(samples)
exmol.plot_space(samples, cfs)
```
Each counterfactual is a Python `dataclass` with information allowing it to be used in your own analysis:
```py
print(cfs[1])
```
```
{
'smiles': 'Cc1onc(-c2ccccc2Cl)c1C(=O)NC1C(=O)N2C1SC(C)(C)C2C',
'selfies': '[C][C][O][N][=C][Branch1_1][Branch2_3][C][=C][C][=C][C][=C][Ring1][Branch1_2][Cl][C]
[Expl=Ring1][N][C][Branch1_2][C][=O][N][C][C][Branch1_2][C][=O][N][C][Ring1][Branch1_1][S][C]
[Branch1_1][C][C][Branch1_1][C][C][C][Ring1][Branch1_3][C]',
'similarity': 0.8,
'yhat': 1,
'index': 1813,
'position': array([-7.8032394 , 0.51781263]),
'is_origin': False,
'cluster': -1,
'label': 'Counterfactual 1'
}
```
We can use the same chemical space to get descriptor attributions for the molecule. Along with `samples`, we also need to specify the `descriptor_type` to get attributions. You can select from `Classic` Rdkit descriptors, `MACCS` fingerprint descriptors, `ECFP` substructure descriptors. The default `descriptor_type` is `MACCS`. If you'd like to use regression coefficients for analysis, specify `return_beta=True`. The descriptor t-statistics are stored in `descriptors.tstats` attribute for the base molecule and can be accessed using `space_tstats = space[0].descriptors.tstats`. `plot_descriptors` saves a plot as shown below in the `output_file`.
```py
beta = exmol.lime_explain(samples, descriptor_type='ECFP', return_beta=True)
exmol.plot_descriptors(samples, output_file='ecfp.svg')
```
You can use a more typical atom attribution plot as well, although note that some information is lost in this representation.
```py
exmol.plot_utils.similarity_map_using_tstats(samples[0])
```
You can also plot the chemical space colored by fit to see how well the regression fits the original model. To plot by fit, regression coefficients `beta` need to be passed in as an argument.
```py
exmol.plot_utils.plot_space_by_fit(
samples,
[samples[0]],
beta=beta,
mol_size=(300, 250),
figure_kwargs={'figsize': (7,5)},
)
```
It is also possible to get global attributions for multiple base molecules. For this, the user should create a space around each instance of interest and concatenate these spaces. Then use this joint space to do lime explanations:
```py
beta = exmol.lime_explain(joint_space, descriptor_type='ECFP', return_beta=True, multiple_bases=True)
```
`lime_explain()` uses a linear surrogate model for descriptor explanations. You can also use a custom surrogate model instead of a linear model. To do so, just add desired descriptors to the chemical space using the `add_descriptors()` function and then use a custom model on samples to get explanations. For example, add ECFP descriptors using `exmol.add_descriptors(samples, descriptor_type='ECFP')`.
## Further Examples
You can find more examples by looking at the exact code used to generate all figures from our paper [in the docs webpage](https://ur-whitelab.github.io/exmol/toc.html).
## Chemical Space
When calling `exmol.sample_space` you can pass `preset=`, which can be
one of the following:
* `'narrow'`: Only one change to molecular structure, reduced set of possible bonds/elements
* `'medium'`: Default. One or two changes to molecular structure, reduced set of possible bonds/elements
* `'wide'`: One through five changes to molecular structure, large set of possible bonds/elements
* `'chemed'`: A restricted set where only pubchem molecules are considered.
* `'custom'`: A restricted set where only molecules provided by the "data" key are considered.
* `'synspace'`: Chemical space is generated by running retro and forward synthesis reactions, so all generaterd molecules are synthetically feasible. Uses [synspace](https://github.com/whitead/synspace) package.
You can also pass `num_samples` as a "request" for number of samples. You will typically end up with less due to
degenerate molecules. See API for complete description.
## SVG
Molecules are by default drawn as PNGs. If you would like to have them drawn as SVGs, call `insert_svg` after calling
`plot_space` or `plot_cf`
```py
import skunk
exmol.plot_cf(exps)
svg = exmol.insert_svg(exps, mol_fontsize=16)
# for Jupyter Notebook
skunk.display(svg)
# To save to file
with open('myplot.svg', 'w') as f:
f.write(svg)
```
This is done with the [skunk🦨 library](https://github.com/whitead/skunk).
## Disable Progress Bars
If `exmol` is being too loud, add `quiet = True` to `sample_space` arguments.
## API and Docs
[Read API here](https://ur-whitelab.github.io/exmol/api.html). You should also read the paper (see below) for a more exact
description of the methods and implementation.
## Developing
This repo uses pre-commit, so after cloning run `pip install -r requirements.txt` and `pre-commit install` prior to committing.
## Citation
For the counterfactual work, please cite [Wellawatte et al.](https://pubs.rsc.org/en/content/articlelanding/2022/sc/d1sc05259d#!divAbstract)
```bibtex
@Article{wellawatte_seshadri_white_2021,
author ="Wellawatte, Geemi P. and Seshadri, Aditi and White, Andrew D.",
title ="Model agnostic generation of counterfactual explanations for molecules",
journal ="Chem. Sci.",
year ="2022",
pages ="-",
publisher ="The Royal Society of Chemistry",
doi ="10.1039/D1SC05259D",
url ="http://dx.doi.org/10.1039/D1SC05259D",
}
```
For the descriptor explanations, please cite [Gandhi et. al.](https://doi.org/10.26434/chemrxiv-2022-v5p6m-v2)
```bibtex
@Article{gandhi_white_2022,
place = "Cambridge",
title = "Explaining structure-activity relationships using locally faithful surrogate models",
DOI = "10.26434/chemrxiv-2022-v5p6m",
url = "https://doi.org/10.26434/chemrxiv-2022-v5p6m"
journal = "ChemRxiv",
publisher = "Cambridge Open Engage",
author = "Gandhi, Heta A. and White, Andrew D.",
year = "2022"
}
```
%package help
Summary: Development documents and examples for exmol
Provides: python3-exmol-doc
%description help
# Explaining why that molecule
[](https://github.com/ur-whitelab/exmol)
[](https://github.com/ur-whitelab/exmol) [](https://github.com/ur-whitelab/exmol) [](https://ur-whitelab.github.io/exmol/)
[](https://badge.fury.io/py/exmol)
[](https://lbesson.mit-license.org/)
- [Explaining why that molecule](#explaining-why-that-molecule)
- [Install](#install)
- [Quickstart](#quickstart)
- [Counterfactual Generation](#counterfactual-generation)
- [Descriptor Attribution](#descriptor-attribution)
- [Usage](#usage)
- [Further Examples](#further-examples)
- [Chemical Space](#chemical-space)
- [SVG](#svg)
- [Disable Progress Bars](#disable-progress-bars)
- [API and Docs](#api-and-docs)
- [Developing](#developing)
- [Citation](#citation)
`exmol` is a package to explain black-box predictions of molecules. The package uses model agnostic explanations to help users understand why a molecule is predicted to have a property.
## Install
```sh
pip install exmol
```
## Quickstart
See [the tutorial](https://ur-whitelab.github.io/exmol/paper2_LIME/Tutorial.html) to give an overview of the basic usage of exmol.
## Counterfactual Generation
Our package implements the Model Agnostic Counterfactual Compounds with STONED to generate counterfactuals.
A counterfactual can explain a prediction by showing what would have to change in the molecule to change its predicted class. Here is an example of a counterfactual:
> This package is not popular. If the package had a logo, it would be popular.
In addition to having a changed prediction, a molecular counterfactual must be similar to its base molecule as much as possible. Here is an example of a molecular counterfactual:
The counterfactual shows that if the carboxylic acid were an ester, the molecule would be active. It is up to the user to translate this set of structures into a meaningful sentence.
## Descriptor Attribution
This package also implements Model Agnostic Descriptor Attribution for molecules using LIME.
Descriptor attributions can explain a prediction by computing QSARs for molecular structure properties independent of features used for model predictions. Here is an example of descriptor attribution:
The descriptor t-statistics show which chemical properties or substructures influence properety prediction for the pictured molecule. LIME is a perturbation based method and the descriptor attributions depend on the perturbed chemical space created around the molecule of interest.
## Usage
Let's assume you have a deep learning model `my_model(s)` that takes in one SMILES string and outputs a predicted binary class. We first expand chemical space around the prediction of interest
```py
import exmol
# mol of interest
base = 'Cc1onc(-c2ccccc2Cl)c1C(=O)NC1C(=O)N2C1SC(C)(C)C2C(=O)O'
samples = exmol.sample_space(base, my_model, batched=False)
```
We uses `batched=False` to indicate `my_model` cannot handle a batch of SMILES, just one at a time. If your model takes SELFIES, just pass `use_selfies=True` to `sample_space`. Now we select counterfactuals from that space and plot them.
```py
cfs = exmol.cf_explain(samples)
exmol.plot_cf(cfs)
```
We can also plot the space around the counterfactual. This is computed via PCA of the affinity matrix -- the similarity (Tanimoto of ECFP4) with the base molecule.
Due to how similarity is calculated, the base is going to be the farthest from all other molecules. Thus your base should fall on the left (or right) extreme of your plot.
```py
cfs = exmol.cf_explain(samples)
exmol.plot_space(samples, cfs)
```
Each counterfactual is a Python `dataclass` with information allowing it to be used in your own analysis:
```py
print(cfs[1])
```
```
{
'smiles': 'Cc1onc(-c2ccccc2Cl)c1C(=O)NC1C(=O)N2C1SC(C)(C)C2C',
'selfies': '[C][C][O][N][=C][Branch1_1][Branch2_3][C][=C][C][=C][C][=C][Ring1][Branch1_2][Cl][C]
[Expl=Ring1][N][C][Branch1_2][C][=O][N][C][C][Branch1_2][C][=O][N][C][Ring1][Branch1_1][S][C]
[Branch1_1][C][C][Branch1_1][C][C][C][Ring1][Branch1_3][C]',
'similarity': 0.8,
'yhat': 1,
'index': 1813,
'position': array([-7.8032394 , 0.51781263]),
'is_origin': False,
'cluster': -1,
'label': 'Counterfactual 1'
}
```
We can use the same chemical space to get descriptor attributions for the molecule. Along with `samples`, we also need to specify the `descriptor_type` to get attributions. You can select from `Classic` Rdkit descriptors, `MACCS` fingerprint descriptors, `ECFP` substructure descriptors. The default `descriptor_type` is `MACCS`. If you'd like to use regression coefficients for analysis, specify `return_beta=True`. The descriptor t-statistics are stored in `descriptors.tstats` attribute for the base molecule and can be accessed using `space_tstats = space[0].descriptors.tstats`. `plot_descriptors` saves a plot as shown below in the `output_file`.
```py
beta = exmol.lime_explain(samples, descriptor_type='ECFP', return_beta=True)
exmol.plot_descriptors(samples, output_file='ecfp.svg')
```
You can use a more typical atom attribution plot as well, although note that some information is lost in this representation.
```py
exmol.plot_utils.similarity_map_using_tstats(samples[0])
```
You can also plot the chemical space colored by fit to see how well the regression fits the original model. To plot by fit, regression coefficients `beta` need to be passed in as an argument.
```py
exmol.plot_utils.plot_space_by_fit(
samples,
[samples[0]],
beta=beta,
mol_size=(300, 250),
figure_kwargs={'figsize': (7,5)},
)
```
It is also possible to get global attributions for multiple base molecules. For this, the user should create a space around each instance of interest and concatenate these spaces. Then use this joint space to do lime explanations:
```py
beta = exmol.lime_explain(joint_space, descriptor_type='ECFP', return_beta=True, multiple_bases=True)
```
`lime_explain()` uses a linear surrogate model for descriptor explanations. You can also use a custom surrogate model instead of a linear model. To do so, just add desired descriptors to the chemical space using the `add_descriptors()` function and then use a custom model on samples to get explanations. For example, add ECFP descriptors using `exmol.add_descriptors(samples, descriptor_type='ECFP')`.
## Further Examples
You can find more examples by looking at the exact code used to generate all figures from our paper [in the docs webpage](https://ur-whitelab.github.io/exmol/toc.html).
## Chemical Space
When calling `exmol.sample_space` you can pass `preset=`, which can be
one of the following:
* `'narrow'`: Only one change to molecular structure, reduced set of possible bonds/elements
* `'medium'`: Default. One or two changes to molecular structure, reduced set of possible bonds/elements
* `'wide'`: One through five changes to molecular structure, large set of possible bonds/elements
* `'chemed'`: A restricted set where only pubchem molecules are considered.
* `'custom'`: A restricted set where only molecules provided by the "data" key are considered.
* `'synspace'`: Chemical space is generated by running retro and forward synthesis reactions, so all generaterd molecules are synthetically feasible. Uses [synspace](https://github.com/whitead/synspace) package.
You can also pass `num_samples` as a "request" for number of samples. You will typically end up with less due to
degenerate molecules. See API for complete description.
## SVG
Molecules are by default drawn as PNGs. If you would like to have them drawn as SVGs, call `insert_svg` after calling
`plot_space` or `plot_cf`
```py
import skunk
exmol.plot_cf(exps)
svg = exmol.insert_svg(exps, mol_fontsize=16)
# for Jupyter Notebook
skunk.display(svg)
# To save to file
with open('myplot.svg', 'w') as f:
f.write(svg)
```
This is done with the [skunk🦨 library](https://github.com/whitead/skunk).
## Disable Progress Bars
If `exmol` is being too loud, add `quiet = True` to `sample_space` arguments.
## API and Docs
[Read API here](https://ur-whitelab.github.io/exmol/api.html). You should also read the paper (see below) for a more exact
description of the methods and implementation.
## Developing
This repo uses pre-commit, so after cloning run `pip install -r requirements.txt` and `pre-commit install` prior to committing.
## Citation
For the counterfactual work, please cite [Wellawatte et al.](https://pubs.rsc.org/en/content/articlelanding/2022/sc/d1sc05259d#!divAbstract)
```bibtex
@Article{wellawatte_seshadri_white_2021,
author ="Wellawatte, Geemi P. and Seshadri, Aditi and White, Andrew D.",
title ="Model agnostic generation of counterfactual explanations for molecules",
journal ="Chem. Sci.",
year ="2022",
pages ="-",
publisher ="The Royal Society of Chemistry",
doi ="10.1039/D1SC05259D",
url ="http://dx.doi.org/10.1039/D1SC05259D",
}
```
For the descriptor explanations, please cite [Gandhi et. al.](https://doi.org/10.26434/chemrxiv-2022-v5p6m-v2)
```bibtex
@Article{gandhi_white_2022,
place = "Cambridge",
title = "Explaining structure-activity relationships using locally faithful surrogate models",
DOI = "10.26434/chemrxiv-2022-v5p6m",
url = "https://doi.org/10.26434/chemrxiv-2022-v5p6m"
journal = "ChemRxiv",
publisher = "Cambridge Open Engage",
author = "Gandhi, Heta A. and White, Andrew D.",
year = "2022"
}
```
%prep
%autosetup -n exmol-3.0.3
%build
%py3_build
%install
%py3_install
install -d -m755 %{buildroot}/%{_pkgdocdir}
if [ -d doc ]; then cp -arf doc %{buildroot}/%{_pkgdocdir}; fi
if [ -d docs ]; then cp -arf docs %{buildroot}/%{_pkgdocdir}; fi
if [ -d example ]; then cp -arf example %{buildroot}/%{_pkgdocdir}; fi
if [ -d examples ]; then cp -arf examples %{buildroot}/%{_pkgdocdir}; fi
pushd %{buildroot}
if [ -d usr/lib ]; then
find usr/lib -type f -printf "\"/%h/%f\"\n" >> filelist.lst
fi
if [ -d usr/lib64 ]; then
find usr/lib64 -type f -printf "\"/%h/%f\"\n" >> filelist.lst
fi
if [ -d usr/bin ]; then
find usr/bin -type f -printf "\"/%h/%f\"\n" >> filelist.lst
fi
if [ -d usr/sbin ]; then
find usr/sbin -type f -printf "\"/%h/%f\"\n" >> filelist.lst
fi
touch doclist.lst
if [ -d usr/share/man ]; then
find usr/share/man -type f -printf "\"/%h/%f.gz\"\n" >> doclist.lst
fi
popd
mv %{buildroot}/filelist.lst .
mv %{buildroot}/doclist.lst .
%files -n python3-exmol -f filelist.lst
%dir %{python3_sitelib}/*
%files help -f doclist.lst
%{_docdir}/*
%changelog
* Tue Jun 20 2023 Python_Bot - 3.0.3-1
- Package Spec generated