
diff options
| author | CoprDistGit <infra@openeuler.org> | 2023-05-10 06:33:59 +0000 |
|---|---|---|
| committer | CoprDistGit <infra@openeuler.org> | 2023-05-10 06:33:59 +0000 |
| commit | 9a5c5485d32fc40e7b65c9d05f53cc6104db0e81 (patch) | |
| tree | 5d77221a356e5a3adfe41fe77a6f7db00be99571 | |
| parent | bfb8e189339143550b8305b1891f138b91991a71 (diff) | |
automatic import of python-finplot
| -rw-r--r-- | .gitignore | 1 | ||||
| -rw-r--r-- | python-finplot.spec | 290 | ||||
| -rw-r--r-- | sources | 1 |
3 files changed, 292 insertions, 0 deletions
@@ -0,0 +1 @@ +/finplot-1.9.1.tar.gz diff --git a/python-finplot.spec b/python-finplot.spec new file mode 100644 index 0000000..215baf8 --- /dev/null +++ b/python-finplot.spec @@ -0,0 +1,290 @@ +%global _empty_manifest_terminate_build 0 +Name: python-finplot +Version: 1.9.1 +Release: 1 +Summary: Finance plotting +License: MIT License +URL: https://github.com/highfestiva/finplot +Source0: https://mirrors.nju.edu.cn/pypi/web/packages/a0/e8/0fb422079d92d26319c076b149da4731f9fc644a3dc219113b286a4356e6/finplot-1.9.1.tar.gz +BuildArch: noarch + +Requires: python3-numpy +Requires: python3-pandas +Requires: python3-PyQt6 +Requires: python3-pyqtgraph +Requires: python3-dateutil + +%description +# Finance Plot
+
+Finance Plotter, or finplot, is a performant library with a clean api to help you with your backtesting. It's
+optionated with good defaults, so you can start doing your work without having to setup plots, colors, scales,
+autoscaling, keybindings, handle panning+vertical zooming (which all non-finance libraries have problems with).
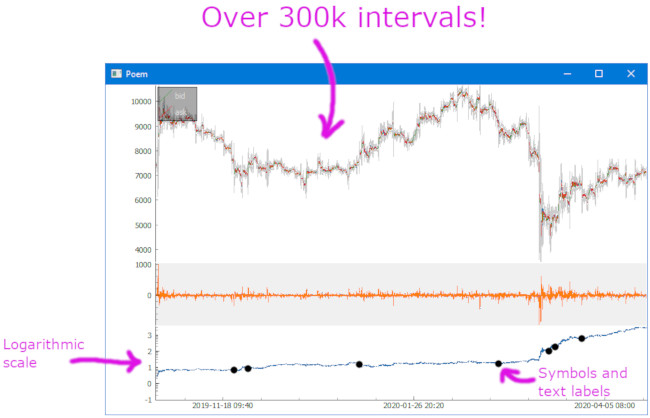
+And best of all: it can show hundreds of thousands of datapoints without batting an eye.
+
+<img src="https://badge.fury.io/py/finplot.svg"/> <img src="https://pepy.tech/badge/finplot/month"/> <img src="https://img.shields.io/badge/License-MIT-yellow.svg"/>
+
+
+## Features
+
+* Great performance compared to mpl_finance, plotly and Bokeh
+* Clean api
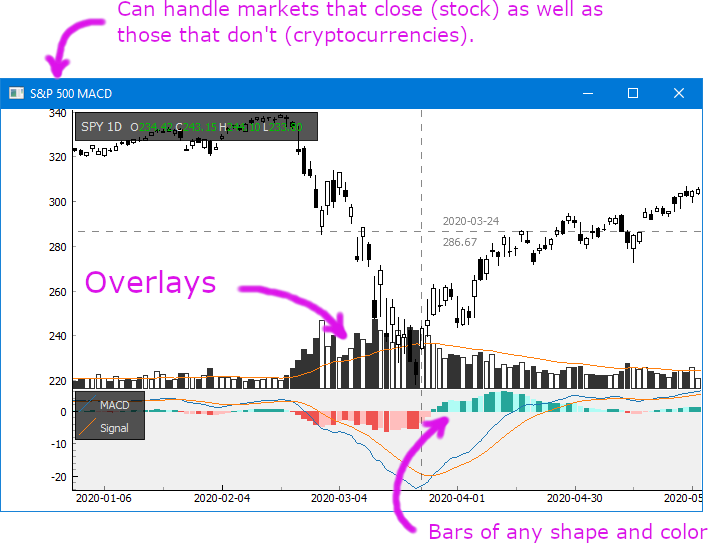
+* Works with both stocks as well as cryptocurrencies on any time resolution
+* Show as many charts as you want on the same time axis, zoom on all of them at once
+* Auto-reload position where you were looking last run
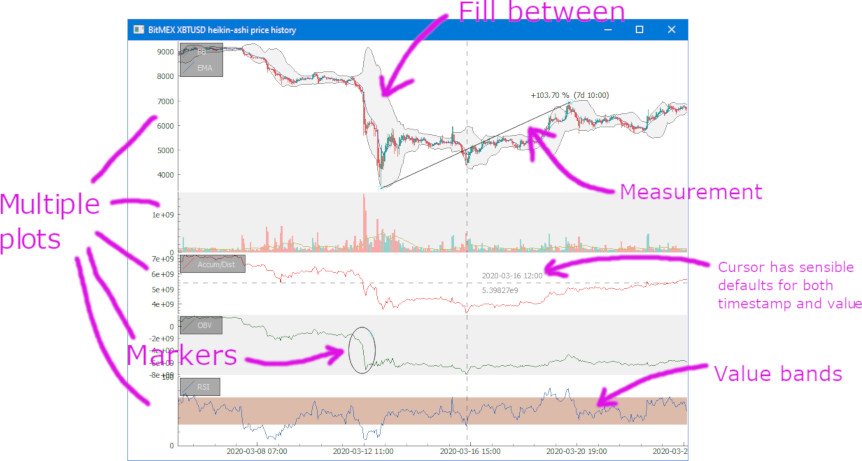
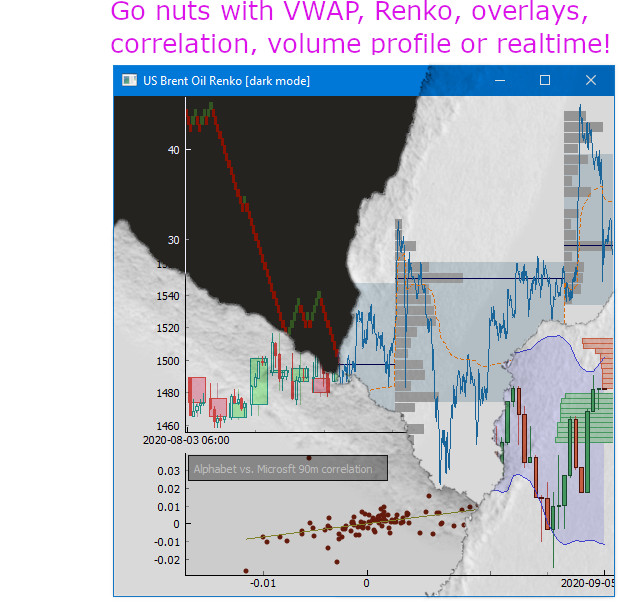
+* Overlays, fill between, value bands, symbols, labels, legend, volume profile, heatmaps, etc.
+* Can show real-time updates, including orderbook. Save screenshot.
+* Comes with a [dozen](https://github.com/highfestiva/finplot/blob/master/finplot/examples) great examples.
+
+
+
+
+
+
+
+
+
+
+## What it is not
+
+finplot *is not a web app*. It does not help you create an homebrew exchange. It does not work with Jupyter Labs.
+
+It is only intended for you to do backtesting in. That is not to say that you can't create a ticker or a trade
+widget yourself. The library is based on the eminent pyqtgraph, which is fast and flexible, so feel free to hack
+away if that's what you want.
+
+
+## Easy installation
+
+```bash
+$ pip install finplot
+```
+
+
+## Example
+
+It's straight-forward to start using. This shows every daily candle of Apple since the 80'ies:
+
+```python
+import finplot as fplt
+import yfinance
+
+df = yfinance.download('AAPL')
+fplt.candlestick_ochl(df[['Open', 'Close', 'High', 'Low']])
+fplt.show()
+```
+
+For more examples and a bunch of snippets, see the [examples](https://github.com/highfestiva/finplot/blob/master/finplot/examples/)
+directory or the [wiki](https://github.com/highfestiva/finplot/wiki). There you'll find how to plot MACD, Parabolic SAR, RSI,
+volume profile and much more.
+
+
+## Coffee
+
+For future support and features, consider a small donation.
+
+BTC: bc1qk8m8yh86l2pz4eypflchr0tkn5aeud6cmt426m
+
+ETH: 0x684d7d4C52ed428AE9a36B2407ba909D896cDB67
+ + +%package -n python3-finplot +Summary: Finance plotting +Provides: python-finplot +BuildRequires: python3-devel +BuildRequires: python3-setuptools +BuildRequires: python3-pip +%description -n python3-finplot +# Finance Plot
+
+Finance Plotter, or finplot, is a performant library with a clean api to help you with your backtesting. It's
+optionated with good defaults, so you can start doing your work without having to setup plots, colors, scales,
+autoscaling, keybindings, handle panning+vertical zooming (which all non-finance libraries have problems with).
+And best of all: it can show hundreds of thousands of datapoints without batting an eye.
+
+<img src="https://badge.fury.io/py/finplot.svg"/> <img src="https://pepy.tech/badge/finplot/month"/> <img src="https://img.shields.io/badge/License-MIT-yellow.svg"/>
+
+
+## Features
+
+* Great performance compared to mpl_finance, plotly and Bokeh
+* Clean api
+* Works with both stocks as well as cryptocurrencies on any time resolution
+* Show as many charts as you want on the same time axis, zoom on all of them at once
+* Auto-reload position where you were looking last run
+* Overlays, fill between, value bands, symbols, labels, legend, volume profile, heatmaps, etc.
+* Can show real-time updates, including orderbook. Save screenshot.
+* Comes with a [dozen](https://github.com/highfestiva/finplot/blob/master/finplot/examples) great examples.
+
+
+
+
+
+
+
+
+
+
+## What it is not
+
+finplot *is not a web app*. It does not help you create an homebrew exchange. It does not work with Jupyter Labs.
+
+It is only intended for you to do backtesting in. That is not to say that you can't create a ticker or a trade
+widget yourself. The library is based on the eminent pyqtgraph, which is fast and flexible, so feel free to hack
+away if that's what you want.
+
+
+## Easy installation
+
+```bash
+$ pip install finplot
+```
+
+
+## Example
+
+It's straight-forward to start using. This shows every daily candle of Apple since the 80'ies:
+
+```python
+import finplot as fplt
+import yfinance
+
+df = yfinance.download('AAPL')
+fplt.candlestick_ochl(df[['Open', 'Close', 'High', 'Low']])
+fplt.show()
+```
+
+For more examples and a bunch of snippets, see the [examples](https://github.com/highfestiva/finplot/blob/master/finplot/examples/)
+directory or the [wiki](https://github.com/highfestiva/finplot/wiki). There you'll find how to plot MACD, Parabolic SAR, RSI,
+volume profile and much more.
+
+
+## Coffee
+
+For future support and features, consider a small donation.
+
+BTC: bc1qk8m8yh86l2pz4eypflchr0tkn5aeud6cmt426m
+
+ETH: 0x684d7d4C52ed428AE9a36B2407ba909D896cDB67
+ + +%package help +Summary: Development documents and examples for finplot +Provides: python3-finplot-doc +%description help +# Finance Plot
+
+Finance Plotter, or finplot, is a performant library with a clean api to help you with your backtesting. It's
+optionated with good defaults, so you can start doing your work without having to setup plots, colors, scales,
+autoscaling, keybindings, handle panning+vertical zooming (which all non-finance libraries have problems with).
+And best of all: it can show hundreds of thousands of datapoints without batting an eye.
+
+<img src="https://badge.fury.io/py/finplot.svg"/> <img src="https://pepy.tech/badge/finplot/month"/> <img src="https://img.shields.io/badge/License-MIT-yellow.svg"/>
+
+
+## Features
+
+* Great performance compared to mpl_finance, plotly and Bokeh
+* Clean api
+* Works with both stocks as well as cryptocurrencies on any time resolution
+* Show as many charts as you want on the same time axis, zoom on all of them at once
+* Auto-reload position where you were looking last run
+* Overlays, fill between, value bands, symbols, labels, legend, volume profile, heatmaps, etc.
+* Can show real-time updates, including orderbook. Save screenshot.
+* Comes with a [dozen](https://github.com/highfestiva/finplot/blob/master/finplot/examples) great examples.
+
+
+
+
+
+
+
+
+
+
+## What it is not
+
+finplot *is not a web app*. It does not help you create an homebrew exchange. It does not work with Jupyter Labs.
+
+It is only intended for you to do backtesting in. That is not to say that you can't create a ticker or a trade
+widget yourself. The library is based on the eminent pyqtgraph, which is fast and flexible, so feel free to hack
+away if that's what you want.
+
+
+## Easy installation
+
+```bash
+$ pip install finplot
+```
+
+
+## Example
+
+It's straight-forward to start using. This shows every daily candle of Apple since the 80'ies:
+
+```python
+import finplot as fplt
+import yfinance
+
+df = yfinance.download('AAPL')
+fplt.candlestick_ochl(df[['Open', 'Close', 'High', 'Low']])
+fplt.show()
+```
+
+For more examples and a bunch of snippets, see the [examples](https://github.com/highfestiva/finplot/blob/master/finplot/examples/)
+directory or the [wiki](https://github.com/highfestiva/finplot/wiki). There you'll find how to plot MACD, Parabolic SAR, RSI,
+volume profile and much more.
+
+
+## Coffee
+
+For future support and features, consider a small donation.
+
+BTC: bc1qk8m8yh86l2pz4eypflchr0tkn5aeud6cmt426m
+
+ETH: 0x684d7d4C52ed428AE9a36B2407ba909D896cDB67
+ + +%prep +%autosetup -n finplot-1.9.1 + +%build +%py3_build + +%install +%py3_install +install -d -m755 %{buildroot}/%{_pkgdocdir} +if [ -d doc ]; then cp -arf doc %{buildroot}/%{_pkgdocdir}; fi +if [ -d docs ]; then cp -arf docs %{buildroot}/%{_pkgdocdir}; fi +if [ -d example ]; then cp -arf example %{buildroot}/%{_pkgdocdir}; fi +if [ -d examples ]; then cp -arf examples %{buildroot}/%{_pkgdocdir}; fi +pushd %{buildroot} +if [ -d usr/lib ]; then + find usr/lib -type f -printf "/%h/%f\n" >> filelist.lst +fi +if [ -d usr/lib64 ]; then + find usr/lib64 -type f -printf "/%h/%f\n" >> filelist.lst +fi +if [ -d usr/bin ]; then + find usr/bin -type f -printf "/%h/%f\n" >> filelist.lst +fi +if [ -d usr/sbin ]; then + find usr/sbin -type f -printf "/%h/%f\n" >> filelist.lst +fi +touch doclist.lst +if [ -d usr/share/man ]; then + find usr/share/man -type f -printf "/%h/%f.gz\n" >> doclist.lst +fi +popd +mv %{buildroot}/filelist.lst . +mv %{buildroot}/doclist.lst . + +%files -n python3-finplot -f filelist.lst +%dir %{python3_sitelib}/* + +%files help -f doclist.lst +%{_docdir}/* + +%changelog +* Wed May 10 2023 Python_Bot <Python_Bot@openeuler.org> - 1.9.1-1 +- Package Spec generated @@ -0,0 +1 @@ +4964f700ba190e67b896616e389089b0 finplot-1.9.1.tar.gz |