
diff options
| author | CoprDistGit <infra@openeuler.org> | 2023-05-31 05:59:20 +0000 |
|---|---|---|
| committer | CoprDistGit <infra@openeuler.org> | 2023-05-31 05:59:20 +0000 |
| commit | f3d4fc32654b0978a09f68dfc829e1ba0d7bb41b (patch) | |
| tree | 4f0943c3d73db88b189dad8857816d27b5a3bf1d | |
| parent | 8e9e372c487cb37c3a415d0a3c05d84987fc23c5 (diff) | |
automatic import of python-tsextract
| -rw-r--r-- | .gitignore | 1 | ||||
| -rw-r--r-- | python-tsextract.spec | 552 | ||||
| -rw-r--r-- | sources | 1 |
3 files changed, 554 insertions, 0 deletions
@@ -0,0 +1 @@ +/tsextract-0.0.9.tar.gz diff --git a/python-tsextract.spec b/python-tsextract.spec new file mode 100644 index 0000000..cc0f178 --- /dev/null +++ b/python-tsextract.spec @@ -0,0 +1,552 @@ +%global _empty_manifest_terminate_build 0 +Name: python-tsextract +Version: 0.0.9 +Release: 1 +Summary: Time series data preprocessing +License: GNU GPL +URL: https://github.com/cydal/tsExtract/tree/master/tsextract +Source0: https://mirrors.nju.edu.cn/pypi/web/packages/12/4d/8f5bf8123dd352f6559b623bf317c080771bf1371ef23ab76491b98d9082/tsextract-0.0.9.tar.gz +BuildArch: noarch + +Requires: python3-pandas +Requires: python3-plotnine +Requires: python3-statsmodels +Requires: python3-scipy +Requires: python3-matplotlib +Requires: python3-numpy + +%description + + + +## tsExtract: Time Series Preprocessing Library + +tsExtract is a time series preprocessing library. Using sliding windows, tsExtract allows for the conversion of time series data to a form that can be fed into standard machine learning regression algorithms like Linear Regression, Decision Trees Regression and as well as Deep Learning. + +      +[](https://www.codetriage.com/cydal/tsextract) + + + +# Installation + +<code> pip </code> + +> **pip install tsextract** + +<code> conda </code> +> **conda install -c cydal tsextract** + + + +## Main Features + +* Take sliding window of data and with that, create additional columns representing the window. +* Perform differencing on windowed data to remove non-stationarity. +* Calculate statistics on windowed and differenced data. These include temporal and spectral statistics functions. +* Plot visualisations. These include - +* * Actual vs Predicted line and scatter plots +* * Lag correlation + +## Usage + +### [Example Notebooks](https://github.com/cydal/tsExtract/tree/master/examples) + +```python +print(df.head()) +``` + + +| |Date |DAYTON_MW | +|----------------|-------------------------------|-----------------------------| +| |`2004-12-31 01:00:00` |`1596.0` | +| |`2004-12-31 02:00:00` | `1517.0` | +| |`2004-12-31 03:00:00`|`1486.0`| +| | `2004-12-31 04:00:00`|`1469.0` | +| |`2004-12-31 05:00:00` | `1472.0` | + + + +Using the main **build_features** function + + +**build_features** takes in 4 arguments - +* **Data**: Time series data in 1d. + +* **Request Dictionary**: Dictionary with the function type and parameters +* **Include_tzero** (optional) - This gives the option on whether to include the column t+0. Can be quite handy when implementing difference networks. +* **target_lag** - Sets lag value. If predicting 10 hours into the future, then a value of 10 should be included. Default is 3. + +```python +from tsextract.feature_extraction.extract import build_features + +features_request = { + "window":[10] +} + +features = build_features(df["DAYTON_MW"], features_request, include_tzero=False) +``` + +The example above sends in a request for a sliding window size of 10. What is returned is a dataframe with 10 columns equal to the window size passed in. The final column is the target column with values shifted 3 time steps in the future. + + +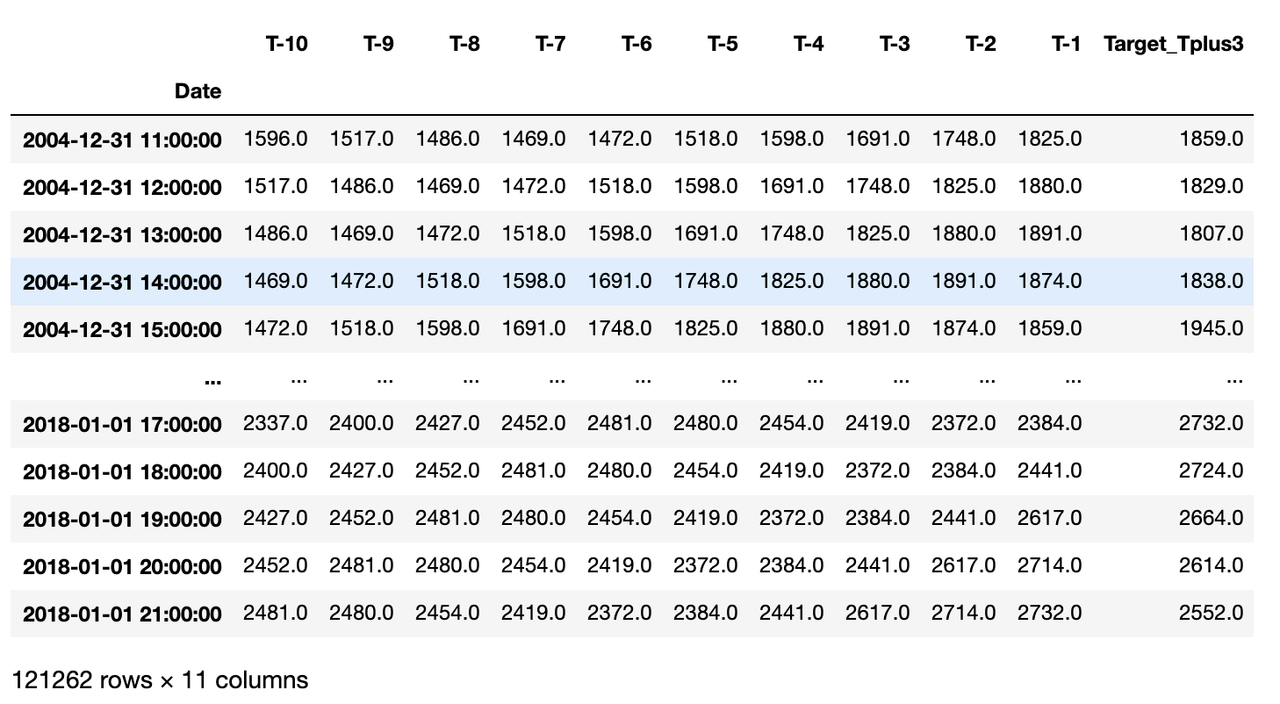 + + +### Features + +* **window**: Takes sliding window of the data. Parameter(s) passed in as a list. A single value will take a sliding window corresponding to that value. A parameter of 10 will take windows from 1 to 10. If [5, 10] is passed in instead, then a window of 5 to 10 time steps will be taken instead. + +* **window_statistic**: This performs windowing like above, but then applies specified statistic operation to reduce matrix to a vector of 1d. + +* **difference/momentum/force**: Performs differencing by subtracting from the value in the present time step, the value in the previous time step. The parameter expected is a list of size 2 or 3. Just like in windowing, the first value refers to the window size. Two windowing values may also be passed in for windows in that range. +The final value is the lag, this refers to the differencing lag for subtraction. A difference lag of 1 means values are subtracted from immediate past values (t3-t2, t2-t1, t1-t0 e.t.c) while a difference lag of 3 will subtract from 3 time steps before (t6-t3, t5-t2, t4-t1 e.t.c). +Momentum & Force are 2nd & 3rd order differences. + +* **difference_statistic/momentum_statistic/force_statistic**: Similarly, this performs the operations described above, but then applies the specified statistic. + +```python +from tsextract.feature_extraction.extract import build_features +from tsextract.domain.statistics import median, mean, skew, kurtosis +from tsextract.domain.temporal import abs_energy + +features_request = { + "window":[2], + "window_statistic":[24, median], + "difference":[12, 10], + "difference_statistic":[15, 10, abs_energy], +} + +features = build_features(df["DAYTON_MW"], features_request, include_tzero=True, target_lag=3) +``` + +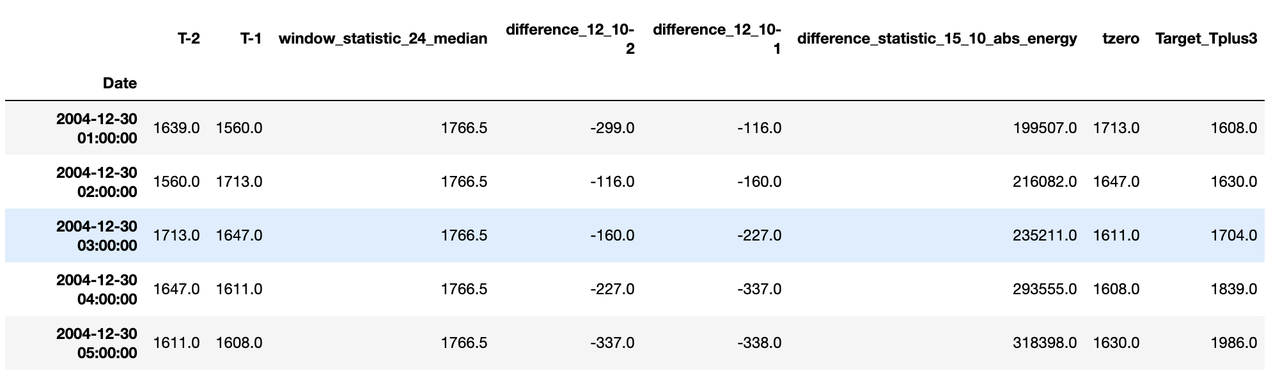 + +# Summary Statistics + + +As described above, rather than take raw windowing or differencing matrix values, it is possible to take some summary statistic of it. See supported features. + + +| Statistics | Temporal | Spectral | +| :--- | :----: | ---: | +| Mean | Absolute Energy | Spectral Centroid | +| Median | AUC | | +| Range | Mean Absolute Difference | | +| Standard Deviation | Moment | | +| Minimum | Autocorrelation | | +| Maximum | Zero Crossing Rate | | +| Range | | | +| Variance | | | +| Kurtosis | | | +| Skew | | | +| IQR | | | +| MAE | | | +| RMSE | | | + + + + +## Dependencies + +* pandas >= 1.0.3 +* seaborn >= 0.10.1 +* statsmodels >= 0.11.1 +* scipy >= 1.5.0 +* matplotlib >= 3.2.1 +* numpy >= 1.16.4 + + +## License + +[GNU GPL V3](http://www.gnu.org/licenses/quick-guide-gplv3.html) + + +# Contribute + +Contributors of all experience levels are welcome. Please see the contributing guide. + + +### Source Code + +<code> You can get the latest source code </code> + +> git clone https://github.com/cydal/tsExtract.git + + + + +%package -n python3-tsextract +Summary: Time series data preprocessing +Provides: python-tsextract +BuildRequires: python3-devel +BuildRequires: python3-setuptools +BuildRequires: python3-pip +%description -n python3-tsextract + + + +## tsExtract: Time Series Preprocessing Library + +tsExtract is a time series preprocessing library. Using sliding windows, tsExtract allows for the conversion of time series data to a form that can be fed into standard machine learning regression algorithms like Linear Regression, Decision Trees Regression and as well as Deep Learning. + +      +[](https://www.codetriage.com/cydal/tsextract) + + + +# Installation + +<code> pip </code> + +> **pip install tsextract** + +<code> conda </code> +> **conda install -c cydal tsextract** + + + +## Main Features + +* Take sliding window of data and with that, create additional columns representing the window. +* Perform differencing on windowed data to remove non-stationarity. +* Calculate statistics on windowed and differenced data. These include temporal and spectral statistics functions. +* Plot visualisations. These include - +* * Actual vs Predicted line and scatter plots +* * Lag correlation + +## Usage + +### [Example Notebooks](https://github.com/cydal/tsExtract/tree/master/examples) + +```python +print(df.head()) +``` + + +| |Date |DAYTON_MW | +|----------------|-------------------------------|-----------------------------| +| |`2004-12-31 01:00:00` |`1596.0` | +| |`2004-12-31 02:00:00` | `1517.0` | +| |`2004-12-31 03:00:00`|`1486.0`| +| | `2004-12-31 04:00:00`|`1469.0` | +| |`2004-12-31 05:00:00` | `1472.0` | + + + +Using the main **build_features** function + + +**build_features** takes in 4 arguments - +* **Data**: Time series data in 1d. + +* **Request Dictionary**: Dictionary with the function type and parameters +* **Include_tzero** (optional) - This gives the option on whether to include the column t+0. Can be quite handy when implementing difference networks. +* **target_lag** - Sets lag value. If predicting 10 hours into the future, then a value of 10 should be included. Default is 3. + +```python +from tsextract.feature_extraction.extract import build_features + +features_request = { + "window":[10] +} + +features = build_features(df["DAYTON_MW"], features_request, include_tzero=False) +``` + +The example above sends in a request for a sliding window size of 10. What is returned is a dataframe with 10 columns equal to the window size passed in. The final column is the target column with values shifted 3 time steps in the future. + + + + + +### Features + +* **window**: Takes sliding window of the data. Parameter(s) passed in as a list. A single value will take a sliding window corresponding to that value. A parameter of 10 will take windows from 1 to 10. If [5, 10] is passed in instead, then a window of 5 to 10 time steps will be taken instead. + +* **window_statistic**: This performs windowing like above, but then applies specified statistic operation to reduce matrix to a vector of 1d. + +* **difference/momentum/force**: Performs differencing by subtracting from the value in the present time step, the value in the previous time step. The parameter expected is a list of size 2 or 3. Just like in windowing, the first value refers to the window size. Two windowing values may also be passed in for windows in that range. +The final value is the lag, this refers to the differencing lag for subtraction. A difference lag of 1 means values are subtracted from immediate past values (t3-t2, t2-t1, t1-t0 e.t.c) while a difference lag of 3 will subtract from 3 time steps before (t6-t3, t5-t2, t4-t1 e.t.c). +Momentum & Force are 2nd & 3rd order differences. + +* **difference_statistic/momentum_statistic/force_statistic**: Similarly, this performs the operations described above, but then applies the specified statistic. + +```python +from tsextract.feature_extraction.extract import build_features +from tsextract.domain.statistics import median, mean, skew, kurtosis +from tsextract.domain.temporal import abs_energy + +features_request = { + "window":[2], + "window_statistic":[24, median], + "difference":[12, 10], + "difference_statistic":[15, 10, abs_energy], +} + +features = build_features(df["DAYTON_MW"], features_request, include_tzero=True, target_lag=3) +``` + + + +# Summary Statistics + + +As described above, rather than take raw windowing or differencing matrix values, it is possible to take some summary statistic of it. See supported features. + + +| Statistics | Temporal | Spectral | +| :--- | :----: | ---: | +| Mean | Absolute Energy | Spectral Centroid | +| Median | AUC | | +| Range | Mean Absolute Difference | | +| Standard Deviation | Moment | | +| Minimum | Autocorrelation | | +| Maximum | Zero Crossing Rate | | +| Range | | | +| Variance | | | +| Kurtosis | | | +| Skew | | | +| IQR | | | +| MAE | | | +| RMSE | | | + + + + +## Dependencies + +* pandas >= 1.0.3 +* seaborn >= 0.10.1 +* statsmodels >= 0.11.1 +* scipy >= 1.5.0 +* matplotlib >= 3.2.1 +* numpy >= 1.16.4 + + +## License + +[GNU GPL V3](http://www.gnu.org/licenses/quick-guide-gplv3.html) + + +# Contribute + +Contributors of all experience levels are welcome. Please see the contributing guide. + + +### Source Code + +<code> You can get the latest source code </code> + +> git clone https://github.com/cydal/tsExtract.git + + + + +%package help +Summary: Development documents and examples for tsextract +Provides: python3-tsextract-doc +%description help + + + +## tsExtract: Time Series Preprocessing Library + +tsExtract is a time series preprocessing library. Using sliding windows, tsExtract allows for the conversion of time series data to a form that can be fed into standard machine learning regression algorithms like Linear Regression, Decision Trees Regression and as well as Deep Learning. + +      +[](https://www.codetriage.com/cydal/tsextract) + + + +# Installation + +<code> pip </code> + +> **pip install tsextract** + +<code> conda </code> +> **conda install -c cydal tsextract** + + + +## Main Features + +* Take sliding window of data and with that, create additional columns representing the window. +* Perform differencing on windowed data to remove non-stationarity. +* Calculate statistics on windowed and differenced data. These include temporal and spectral statistics functions. +* Plot visualisations. These include - +* * Actual vs Predicted line and scatter plots +* * Lag correlation + +## Usage + +### [Example Notebooks](https://github.com/cydal/tsExtract/tree/master/examples) + +```python +print(df.head()) +``` + + +| |Date |DAYTON_MW | +|----------------|-------------------------------|-----------------------------| +| |`2004-12-31 01:00:00` |`1596.0` | +| |`2004-12-31 02:00:00` | `1517.0` | +| |`2004-12-31 03:00:00`|`1486.0`| +| | `2004-12-31 04:00:00`|`1469.0` | +| |`2004-12-31 05:00:00` | `1472.0` | + + + +Using the main **build_features** function + + +**build_features** takes in 4 arguments - +* **Data**: Time series data in 1d. + +* **Request Dictionary**: Dictionary with the function type and parameters +* **Include_tzero** (optional) - This gives the option on whether to include the column t+0. Can be quite handy when implementing difference networks. +* **target_lag** - Sets lag value. If predicting 10 hours into the future, then a value of 10 should be included. Default is 3. + +```python +from tsextract.feature_extraction.extract import build_features + +features_request = { + "window":[10] +} + +features = build_features(df["DAYTON_MW"], features_request, include_tzero=False) +``` + +The example above sends in a request for a sliding window size of 10. What is returned is a dataframe with 10 columns equal to the window size passed in. The final column is the target column with values shifted 3 time steps in the future. + + + + + +### Features + +* **window**: Takes sliding window of the data. Parameter(s) passed in as a list. A single value will take a sliding window corresponding to that value. A parameter of 10 will take windows from 1 to 10. If [5, 10] is passed in instead, then a window of 5 to 10 time steps will be taken instead. + +* **window_statistic**: This performs windowing like above, but then applies specified statistic operation to reduce matrix to a vector of 1d. + +* **difference/momentum/force**: Performs differencing by subtracting from the value in the present time step, the value in the previous time step. The parameter expected is a list of size 2 or 3. Just like in windowing, the first value refers to the window size. Two windowing values may also be passed in for windows in that range. +The final value is the lag, this refers to the differencing lag for subtraction. A difference lag of 1 means values are subtracted from immediate past values (t3-t2, t2-t1, t1-t0 e.t.c) while a difference lag of 3 will subtract from 3 time steps before (t6-t3, t5-t2, t4-t1 e.t.c). +Momentum & Force are 2nd & 3rd order differences. + +* **difference_statistic/momentum_statistic/force_statistic**: Similarly, this performs the operations described above, but then applies the specified statistic. + +```python +from tsextract.feature_extraction.extract import build_features +from tsextract.domain.statistics import median, mean, skew, kurtosis +from tsextract.domain.temporal import abs_energy + +features_request = { + "window":[2], + "window_statistic":[24, median], + "difference":[12, 10], + "difference_statistic":[15, 10, abs_energy], +} + +features = build_features(df["DAYTON_MW"], features_request, include_tzero=True, target_lag=3) +``` + + + +# Summary Statistics + + +As described above, rather than take raw windowing or differencing matrix values, it is possible to take some summary statistic of it. See supported features. + + +| Statistics | Temporal | Spectral | +| :--- | :----: | ---: | +| Mean | Absolute Energy | Spectral Centroid | +| Median | AUC | | +| Range | Mean Absolute Difference | | +| Standard Deviation | Moment | | +| Minimum | Autocorrelation | | +| Maximum | Zero Crossing Rate | | +| Range | | | +| Variance | | | +| Kurtosis | | | +| Skew | | | +| IQR | | | +| MAE | | | +| RMSE | | | + + + + +## Dependencies + +* pandas >= 1.0.3 +* seaborn >= 0.10.1 +* statsmodels >= 0.11.1 +* scipy >= 1.5.0 +* matplotlib >= 3.2.1 +* numpy >= 1.16.4 + + +## License + +[GNU GPL V3](http://www.gnu.org/licenses/quick-guide-gplv3.html) + + +# Contribute + +Contributors of all experience levels are welcome. Please see the contributing guide. + + +### Source Code + +<code> You can get the latest source code </code> + +> git clone https://github.com/cydal/tsExtract.git + + + + +%prep +%autosetup -n tsextract-0.0.9 + +%build +%py3_build + +%install +%py3_install +install -d -m755 %{buildroot}/%{_pkgdocdir} +if [ -d doc ]; then cp -arf doc %{buildroot}/%{_pkgdocdir}; fi +if [ -d docs ]; then cp -arf docs %{buildroot}/%{_pkgdocdir}; fi +if [ -d example ]; then cp -arf example %{buildroot}/%{_pkgdocdir}; fi +if [ -d examples ]; then cp -arf examples %{buildroot}/%{_pkgdocdir}; fi +pushd %{buildroot} +if [ -d usr/lib ]; then + find usr/lib -type f -printf "/%h/%f\n" >> filelist.lst +fi +if [ -d usr/lib64 ]; then + find usr/lib64 -type f -printf "/%h/%f\n" >> filelist.lst +fi +if [ -d usr/bin ]; then + find usr/bin -type f -printf "/%h/%f\n" >> filelist.lst +fi +if [ -d usr/sbin ]; then + find usr/sbin -type f -printf "/%h/%f\n" >> filelist.lst +fi +touch doclist.lst +if [ -d usr/share/man ]; then + find usr/share/man -type f -printf "/%h/%f.gz\n" >> doclist.lst +fi +popd +mv %{buildroot}/filelist.lst . +mv %{buildroot}/doclist.lst . + +%files -n python3-tsextract -f filelist.lst +%dir %{python3_sitelib}/* + +%files help -f doclist.lst +%{_docdir}/* + +%changelog +* Wed May 31 2023 Python_Bot <Python_Bot@openeuler.org> - 0.0.9-1 +- Package Spec generated @@ -0,0 +1 @@ +c8306cde6540422beaf781dea076fda7 tsextract-0.0.9.tar.gz |