
diff options
| author | CoprDistGit <copr-devel@lists.fedorahosted.org> | 2023-03-09 07:07:32 +0000 |
|---|---|---|
| committer | CoprDistGit <copr-devel@lists.fedorahosted.org> | 2023-03-09 07:07:32 +0000 |
| commit | d7ddbc14e0c6ccc05d473168478fb8c9fe25bab7 (patch) | |
| tree | 9f3d441f16f472611a4359e544102b742773a1f4 | |
| parent | ea2ba5920762dced2a2aaed1d35e9ca7fa94b399 (diff) | |
automatic import of python-django-prometheus
| -rw-r--r-- | .gitignore | 1 | ||||
| -rw-r--r-- | python-django-prometheus.spec | 763 | ||||
| -rw-r--r-- | sources | 1 |
3 files changed, 765 insertions, 0 deletions
@@ -0,0 +1 @@ +/django-prometheus-2.2.0.tar.gz diff --git a/python-django-prometheus.spec b/python-django-prometheus.spec new file mode 100644 index 0000000..364de3e --- /dev/null +++ b/python-django-prometheus.spec @@ -0,0 +1,763 @@ +%global _empty_manifest_terminate_build 0 +Name: python-django-prometheus +Version: 2.2.0 +Release: 1 +Summary: Django middlewares to monitor your application with Prometheus.io. +License: Apache +URL: http://github.com/korfuri/django-prometheus +Source0: https://mirrors.nju.edu.cn/pypi/web/packages/63/12/5325fe5524938eae3beab9e49b48c50676bd20aace4f68daf978215d62d8/django-prometheus-2.2.0.tar.gz +BuildArch: noarch + +Requires: python3-prometheus-client + +%description +# django-prometheus + +Export Django monitoring metrics for Prometheus.io + +[](https://gitter.im/django-prometheus/community?utm_source=badge&utm_medium=badge&utm_campaign=pr-badge&utm_content=badge) + +[](http://badge.fury.io/py/django-prometheus) +[](https://github.com/korfuri/django-prometheus/actions/workflows/ci.yml) +[](https://coveralls.io/github/korfuri/django-prometheus?branch=master) +[](https://pypi.python.org/pypi/django-prometheus) +[](https://github.com/psf/black) + +## Features + +This library provides Prometheus metrics for Django related operations: + +* Requests & Responses +* Database access done via [Django ORM](https://docs.djangoproject.com/en/3.0/topics/db/) +* Cache access done via [Django Cache framework](https://docs.djangoproject.com/en/3.0/topics/cache/) + +## Usage + +### Requirements + +* Django >= 2.2 + +### Installation + +Install with: + +```shell +pip install django-prometheus +``` + +Or, if you're using a development version cloned from this repository: + +```shell +python path-to-where-you-cloned-django-prometheus/setup.py install +``` + +This will install [prometheus_client](https://github.com/prometheus/client_python) as a dependency. + +### Quickstart + +In your settings.py: + +```python +INSTALLED_APPS = [ + ... + 'django_prometheus', + ... +] + +MIDDLEWARE = [ + 'django_prometheus.middleware.PrometheusBeforeMiddleware', + # All your other middlewares go here, including the default + # middlewares like SessionMiddleware, CommonMiddleware, + # CsrfViewmiddleware, SecurityMiddleware, etc. + 'django_prometheus.middleware.PrometheusAfterMiddleware', +] +``` + +In your urls.py: + +```python +urlpatterns = [ + ... + path('', include('django_prometheus.urls')), +] +``` + +### Configuration + +Prometheus uses Histogram based grouping for monitoring latencies. The default +buckets are here: https://github.com/prometheus/client_python/blob/master/prometheus_client/core.py + +You can define custom buckets for latency, adding more buckets decreases performance but +increases accuracy: https://prometheus.io/docs/practices/histograms/ + +```python +PROMETHEUS_LATENCY_BUCKETS = (.1, .2, .5, .6, .8, 1.0, 2.0, 3.0, 4.0, 5.0, 6.0, 7.5, 9.0, 12.0, 15.0, 20.0, 30.0, float("inf")) +``` + +### Monitoring your databases + +SQLite, MySQL, and PostgreSQL databases can be monitored. Just +replace the `ENGINE` property of your database, replacing +`django.db.backends` with `django_prometheus.db.backends`. + +```python +DATABASES = { + 'default': { + 'ENGINE': 'django_prometheus.db.backends.sqlite3', + 'NAME': os.path.join(BASE_DIR, 'db.sqlite3'), + }, +} +``` + +### Monitoring your caches + +Filebased, memcached, redis caches can be monitored. Just replace +the cache backend to use the one provided by django_prometheus +`django.core.cache.backends` with `django_prometheus.cache.backends`. + +```python +CACHES = { + 'default': { + 'BACKEND': 'django_prometheus.cache.backends.filebased.FileBasedCache', + 'LOCATION': '/var/tmp/django_cache', + } +} +``` + +### Monitoring your models + +You may want to monitor the creation/deletion/update rate for your +model. This can be done by adding a mixin to them. This is safe to do +on existing models (it does not require a migration). + +If your model is: + +```python +class Dog(models.Model): + name = models.CharField(max_length=100, unique=True) + breed = models.CharField(max_length=100, blank=True, null=True) + age = models.PositiveIntegerField(blank=True, null=True) +``` + +Just add the `ExportModelOperationsMixin` as such: + +```python +from django_prometheus.models import ExportModelOperationsMixin + +class Dog(ExportModelOperationsMixin('dog'), models.Model): + name = models.CharField(max_length=100, unique=True) + breed = models.CharField(max_length=100, blank=True, null=True) + age = models.PositiveIntegerField(blank=True, null=True) +``` + +This will export 3 metrics, `django_model_inserts_total{model="dog"}`, +`django_model_updates_total{model="dog"}` and +`django_model_deletes_total{model="dog"}`. + +Note that the exported metrics are counters of creations, +modifications and deletions done in the current process. They are not +gauges of the number of objects in the model. + +Starting with Django 1.7, migrations are also monitored. Two gauges +are exported, `django_migrations_applied_by_connection` and +`django_migrations_unapplied_by_connection`. You may want to alert if +there are unapplied migrations. + +If you want to disable the Django migration metrics, set the +`PROMETHEUS_EXPORT_MIGRATIONS` setting to False. + +### Monitoring and aggregating the metrics + +Prometheus is quite easy to set up. An example prometheus.conf to +scrape `127.0.0.1:8001` can be found in `examples/prometheus`. + +Here's an example of a PromDash displaying some of the metrics +collected by django-prometheus: + +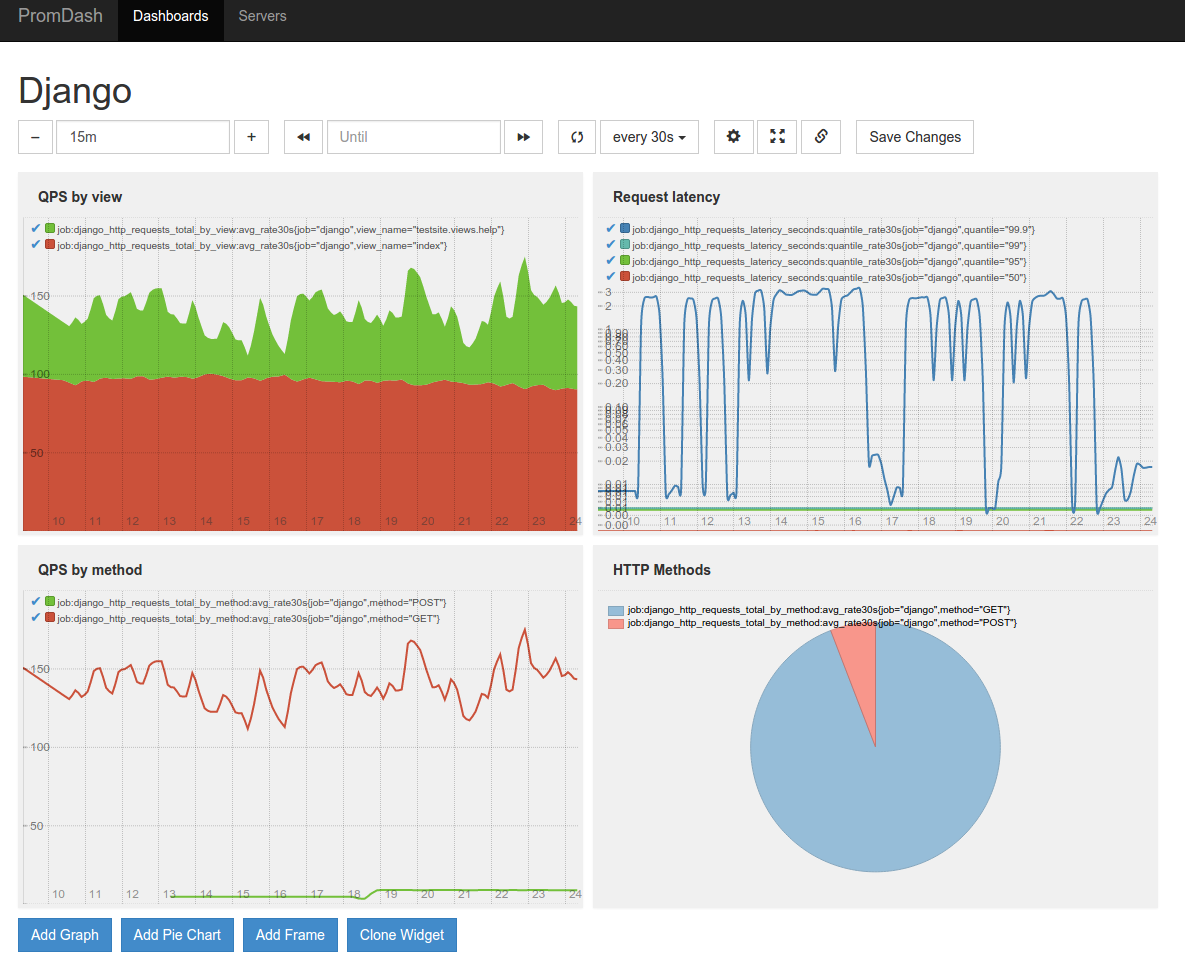 + +## Adding your own metrics + +You can add application-level metrics in your code by using +[prometheus_client](https://github.com/prometheus/client_python) +directly. The exporter is global and will pick up your metrics. + +To add metrics to the Django internals, the easiest way is to extend +django-prometheus' classes. Please consider contributing your metrics, +pull requests are welcome. Make sure to read the Prometheus best +practices on +[instrumentation](http://prometheus.io/docs/practices/instrumentation/) +and [naming](http://prometheus.io/docs/practices/naming/). + +## Importing Django Prometheus using only local settings + +If you wish to use Django Prometheus but are not able to change +the code base, it's possible to have all the default metrics by +modifying only the settings. + +First step is to inject prometheus' middlewares and to add +django_prometheus in INSTALLED_APPS + +```python +MIDDLEWARE = \ + ['django_prometheus.middleware.PrometheusBeforeMiddleware'] + \ + MIDDLEWARE + \ + ['django_prometheus.middleware.PrometheusAfterMiddleware'] + +INSTALLED_APPS += ['django_prometheus'] +``` + +Second step is to create the /metrics end point, for that we need +another file (called urls_prometheus_wrapper.py in this example) that +will wraps the apps URLs and add one on top: + +```python +from django.urls import include, path + + +urlpatterns = [] + +urlpatterns.append(path('prometheus/', include('django_prometheus.urls'))) +urlpatterns.append(path('', include('myapp.urls'))) +``` + +This file will add a "/prometheus/metrics" end point to the URLs of django +that will export the metrics (replace myapp by your project name). + +Then we inject the wrapper in settings: + +```python +ROOT_URLCONF = "graphite.urls_prometheus_wrapper" +``` + +## Adding custom labels to middleware (request/response) metrics + +You can add application specific labels to metrics reported by the django-prometheus middleware. +This involves extending the classes defined in middleware.py. + +* Extend the Metrics class and override the `register_metric` method to add the application specific labels. +* Extend middleware classes, set the metrics_cls class attribute to the the extended metric class and override the label_metric method to attach custom metrics. + +See implementation example in [the test app](django_prometheus/tests/end2end/testapp/test_middleware_custom_labels.py#L19-L46) + + + + +%package -n python3-django-prometheus +Summary: Django middlewares to monitor your application with Prometheus.io. +Provides: python-django-prometheus +BuildRequires: python3-devel +BuildRequires: python3-setuptools +BuildRequires: python3-pip +%description -n python3-django-prometheus +# django-prometheus + +Export Django monitoring metrics for Prometheus.io + +[](https://gitter.im/django-prometheus/community?utm_source=badge&utm_medium=badge&utm_campaign=pr-badge&utm_content=badge) + +[](http://badge.fury.io/py/django-prometheus) +[](https://github.com/korfuri/django-prometheus/actions/workflows/ci.yml) +[](https://coveralls.io/github/korfuri/django-prometheus?branch=master) +[](https://pypi.python.org/pypi/django-prometheus) +[](https://github.com/psf/black) + +## Features + +This library provides Prometheus metrics for Django related operations: + +* Requests & Responses +* Database access done via [Django ORM](https://docs.djangoproject.com/en/3.0/topics/db/) +* Cache access done via [Django Cache framework](https://docs.djangoproject.com/en/3.0/topics/cache/) + +## Usage + +### Requirements + +* Django >= 2.2 + +### Installation + +Install with: + +```shell +pip install django-prometheus +``` + +Or, if you're using a development version cloned from this repository: + +```shell +python path-to-where-you-cloned-django-prometheus/setup.py install +``` + +This will install [prometheus_client](https://github.com/prometheus/client_python) as a dependency. + +### Quickstart + +In your settings.py: + +```python +INSTALLED_APPS = [ + ... + 'django_prometheus', + ... +] + +MIDDLEWARE = [ + 'django_prometheus.middleware.PrometheusBeforeMiddleware', + # All your other middlewares go here, including the default + # middlewares like SessionMiddleware, CommonMiddleware, + # CsrfViewmiddleware, SecurityMiddleware, etc. + 'django_prometheus.middleware.PrometheusAfterMiddleware', +] +``` + +In your urls.py: + +```python +urlpatterns = [ + ... + path('', include('django_prometheus.urls')), +] +``` + +### Configuration + +Prometheus uses Histogram based grouping for monitoring latencies. The default +buckets are here: https://github.com/prometheus/client_python/blob/master/prometheus_client/core.py + +You can define custom buckets for latency, adding more buckets decreases performance but +increases accuracy: https://prometheus.io/docs/practices/histograms/ + +```python +PROMETHEUS_LATENCY_BUCKETS = (.1, .2, .5, .6, .8, 1.0, 2.0, 3.0, 4.0, 5.0, 6.0, 7.5, 9.0, 12.0, 15.0, 20.0, 30.0, float("inf")) +``` + +### Monitoring your databases + +SQLite, MySQL, and PostgreSQL databases can be monitored. Just +replace the `ENGINE` property of your database, replacing +`django.db.backends` with `django_prometheus.db.backends`. + +```python +DATABASES = { + 'default': { + 'ENGINE': 'django_prometheus.db.backends.sqlite3', + 'NAME': os.path.join(BASE_DIR, 'db.sqlite3'), + }, +} +``` + +### Monitoring your caches + +Filebased, memcached, redis caches can be monitored. Just replace +the cache backend to use the one provided by django_prometheus +`django.core.cache.backends` with `django_prometheus.cache.backends`. + +```python +CACHES = { + 'default': { + 'BACKEND': 'django_prometheus.cache.backends.filebased.FileBasedCache', + 'LOCATION': '/var/tmp/django_cache', + } +} +``` + +### Monitoring your models + +You may want to monitor the creation/deletion/update rate for your +model. This can be done by adding a mixin to them. This is safe to do +on existing models (it does not require a migration). + +If your model is: + +```python +class Dog(models.Model): + name = models.CharField(max_length=100, unique=True) + breed = models.CharField(max_length=100, blank=True, null=True) + age = models.PositiveIntegerField(blank=True, null=True) +``` + +Just add the `ExportModelOperationsMixin` as such: + +```python +from django_prometheus.models import ExportModelOperationsMixin + +class Dog(ExportModelOperationsMixin('dog'), models.Model): + name = models.CharField(max_length=100, unique=True) + breed = models.CharField(max_length=100, blank=True, null=True) + age = models.PositiveIntegerField(blank=True, null=True) +``` + +This will export 3 metrics, `django_model_inserts_total{model="dog"}`, +`django_model_updates_total{model="dog"}` and +`django_model_deletes_total{model="dog"}`. + +Note that the exported metrics are counters of creations, +modifications and deletions done in the current process. They are not +gauges of the number of objects in the model. + +Starting with Django 1.7, migrations are also monitored. Two gauges +are exported, `django_migrations_applied_by_connection` and +`django_migrations_unapplied_by_connection`. You may want to alert if +there are unapplied migrations. + +If you want to disable the Django migration metrics, set the +`PROMETHEUS_EXPORT_MIGRATIONS` setting to False. + +### Monitoring and aggregating the metrics + +Prometheus is quite easy to set up. An example prometheus.conf to +scrape `127.0.0.1:8001` can be found in `examples/prometheus`. + +Here's an example of a PromDash displaying some of the metrics +collected by django-prometheus: + + + +## Adding your own metrics + +You can add application-level metrics in your code by using +[prometheus_client](https://github.com/prometheus/client_python) +directly. The exporter is global and will pick up your metrics. + +To add metrics to the Django internals, the easiest way is to extend +django-prometheus' classes. Please consider contributing your metrics, +pull requests are welcome. Make sure to read the Prometheus best +practices on +[instrumentation](http://prometheus.io/docs/practices/instrumentation/) +and [naming](http://prometheus.io/docs/practices/naming/). + +## Importing Django Prometheus using only local settings + +If you wish to use Django Prometheus but are not able to change +the code base, it's possible to have all the default metrics by +modifying only the settings. + +First step is to inject prometheus' middlewares and to add +django_prometheus in INSTALLED_APPS + +```python +MIDDLEWARE = \ + ['django_prometheus.middleware.PrometheusBeforeMiddleware'] + \ + MIDDLEWARE + \ + ['django_prometheus.middleware.PrometheusAfterMiddleware'] + +INSTALLED_APPS += ['django_prometheus'] +``` + +Second step is to create the /metrics end point, for that we need +another file (called urls_prometheus_wrapper.py in this example) that +will wraps the apps URLs and add one on top: + +```python +from django.urls import include, path + + +urlpatterns = [] + +urlpatterns.append(path('prometheus/', include('django_prometheus.urls'))) +urlpatterns.append(path('', include('myapp.urls'))) +``` + +This file will add a "/prometheus/metrics" end point to the URLs of django +that will export the metrics (replace myapp by your project name). + +Then we inject the wrapper in settings: + +```python +ROOT_URLCONF = "graphite.urls_prometheus_wrapper" +``` + +## Adding custom labels to middleware (request/response) metrics + +You can add application specific labels to metrics reported by the django-prometheus middleware. +This involves extending the classes defined in middleware.py. + +* Extend the Metrics class and override the `register_metric` method to add the application specific labels. +* Extend middleware classes, set the metrics_cls class attribute to the the extended metric class and override the label_metric method to attach custom metrics. + +See implementation example in [the test app](django_prometheus/tests/end2end/testapp/test_middleware_custom_labels.py#L19-L46) + + + + +%package help +Summary: Development documents and examples for django-prometheus +Provides: python3-django-prometheus-doc +%description help +# django-prometheus + +Export Django monitoring metrics for Prometheus.io + +[](https://gitter.im/django-prometheus/community?utm_source=badge&utm_medium=badge&utm_campaign=pr-badge&utm_content=badge) + +[](http://badge.fury.io/py/django-prometheus) +[](https://github.com/korfuri/django-prometheus/actions/workflows/ci.yml) +[](https://coveralls.io/github/korfuri/django-prometheus?branch=master) +[](https://pypi.python.org/pypi/django-prometheus) +[](https://github.com/psf/black) + +## Features + +This library provides Prometheus metrics for Django related operations: + +* Requests & Responses +* Database access done via [Django ORM](https://docs.djangoproject.com/en/3.0/topics/db/) +* Cache access done via [Django Cache framework](https://docs.djangoproject.com/en/3.0/topics/cache/) + +## Usage + +### Requirements + +* Django >= 2.2 + +### Installation + +Install with: + +```shell +pip install django-prometheus +``` + +Or, if you're using a development version cloned from this repository: + +```shell +python path-to-where-you-cloned-django-prometheus/setup.py install +``` + +This will install [prometheus_client](https://github.com/prometheus/client_python) as a dependency. + +### Quickstart + +In your settings.py: + +```python +INSTALLED_APPS = [ + ... + 'django_prometheus', + ... +] + +MIDDLEWARE = [ + 'django_prometheus.middleware.PrometheusBeforeMiddleware', + # All your other middlewares go here, including the default + # middlewares like SessionMiddleware, CommonMiddleware, + # CsrfViewmiddleware, SecurityMiddleware, etc. + 'django_prometheus.middleware.PrometheusAfterMiddleware', +] +``` + +In your urls.py: + +```python +urlpatterns = [ + ... + path('', include('django_prometheus.urls')), +] +``` + +### Configuration + +Prometheus uses Histogram based grouping for monitoring latencies. The default +buckets are here: https://github.com/prometheus/client_python/blob/master/prometheus_client/core.py + +You can define custom buckets for latency, adding more buckets decreases performance but +increases accuracy: https://prometheus.io/docs/practices/histograms/ + +```python +PROMETHEUS_LATENCY_BUCKETS = (.1, .2, .5, .6, .8, 1.0, 2.0, 3.0, 4.0, 5.0, 6.0, 7.5, 9.0, 12.0, 15.0, 20.0, 30.0, float("inf")) +``` + +### Monitoring your databases + +SQLite, MySQL, and PostgreSQL databases can be monitored. Just +replace the `ENGINE` property of your database, replacing +`django.db.backends` with `django_prometheus.db.backends`. + +```python +DATABASES = { + 'default': { + 'ENGINE': 'django_prometheus.db.backends.sqlite3', + 'NAME': os.path.join(BASE_DIR, 'db.sqlite3'), + }, +} +``` + +### Monitoring your caches + +Filebased, memcached, redis caches can be monitored. Just replace +the cache backend to use the one provided by django_prometheus +`django.core.cache.backends` with `django_prometheus.cache.backends`. + +```python +CACHES = { + 'default': { + 'BACKEND': 'django_prometheus.cache.backends.filebased.FileBasedCache', + 'LOCATION': '/var/tmp/django_cache', + } +} +``` + +### Monitoring your models + +You may want to monitor the creation/deletion/update rate for your +model. This can be done by adding a mixin to them. This is safe to do +on existing models (it does not require a migration). + +If your model is: + +```python +class Dog(models.Model): + name = models.CharField(max_length=100, unique=True) + breed = models.CharField(max_length=100, blank=True, null=True) + age = models.PositiveIntegerField(blank=True, null=True) +``` + +Just add the `ExportModelOperationsMixin` as such: + +```python +from django_prometheus.models import ExportModelOperationsMixin + +class Dog(ExportModelOperationsMixin('dog'), models.Model): + name = models.CharField(max_length=100, unique=True) + breed = models.CharField(max_length=100, blank=True, null=True) + age = models.PositiveIntegerField(blank=True, null=True) +``` + +This will export 3 metrics, `django_model_inserts_total{model="dog"}`, +`django_model_updates_total{model="dog"}` and +`django_model_deletes_total{model="dog"}`. + +Note that the exported metrics are counters of creations, +modifications and deletions done in the current process. They are not +gauges of the number of objects in the model. + +Starting with Django 1.7, migrations are also monitored. Two gauges +are exported, `django_migrations_applied_by_connection` and +`django_migrations_unapplied_by_connection`. You may want to alert if +there are unapplied migrations. + +If you want to disable the Django migration metrics, set the +`PROMETHEUS_EXPORT_MIGRATIONS` setting to False. + +### Monitoring and aggregating the metrics + +Prometheus is quite easy to set up. An example prometheus.conf to +scrape `127.0.0.1:8001` can be found in `examples/prometheus`. + +Here's an example of a PromDash displaying some of the metrics +collected by django-prometheus: + + + +## Adding your own metrics + +You can add application-level metrics in your code by using +[prometheus_client](https://github.com/prometheus/client_python) +directly. The exporter is global and will pick up your metrics. + +To add metrics to the Django internals, the easiest way is to extend +django-prometheus' classes. Please consider contributing your metrics, +pull requests are welcome. Make sure to read the Prometheus best +practices on +[instrumentation](http://prometheus.io/docs/practices/instrumentation/) +and [naming](http://prometheus.io/docs/practices/naming/). + +## Importing Django Prometheus using only local settings + +If you wish to use Django Prometheus but are not able to change +the code base, it's possible to have all the default metrics by +modifying only the settings. + +First step is to inject prometheus' middlewares and to add +django_prometheus in INSTALLED_APPS + +```python +MIDDLEWARE = \ + ['django_prometheus.middleware.PrometheusBeforeMiddleware'] + \ + MIDDLEWARE + \ + ['django_prometheus.middleware.PrometheusAfterMiddleware'] + +INSTALLED_APPS += ['django_prometheus'] +``` + +Second step is to create the /metrics end point, for that we need +another file (called urls_prometheus_wrapper.py in this example) that +will wraps the apps URLs and add one on top: + +```python +from django.urls import include, path + + +urlpatterns = [] + +urlpatterns.append(path('prometheus/', include('django_prometheus.urls'))) +urlpatterns.append(path('', include('myapp.urls'))) +``` + +This file will add a "/prometheus/metrics" end point to the URLs of django +that will export the metrics (replace myapp by your project name). + +Then we inject the wrapper in settings: + +```python +ROOT_URLCONF = "graphite.urls_prometheus_wrapper" +``` + +## Adding custom labels to middleware (request/response) metrics + +You can add application specific labels to metrics reported by the django-prometheus middleware. +This involves extending the classes defined in middleware.py. + +* Extend the Metrics class and override the `register_metric` method to add the application specific labels. +* Extend middleware classes, set the metrics_cls class attribute to the the extended metric class and override the label_metric method to attach custom metrics. + +See implementation example in [the test app](django_prometheus/tests/end2end/testapp/test_middleware_custom_labels.py#L19-L46) + + + + +%prep +%autosetup -n django-prometheus-2.2.0 + +%build +%py3_build + +%install +%py3_install +install -d -m755 %{buildroot}/%{_pkgdocdir} +if [ -d doc ]; then cp -arf doc %{buildroot}/%{_pkgdocdir}; fi +if [ -d docs ]; then cp -arf docs %{buildroot}/%{_pkgdocdir}; fi +if [ -d example ]; then cp -arf example %{buildroot}/%{_pkgdocdir}; fi +if [ -d examples ]; then cp -arf examples %{buildroot}/%{_pkgdocdir}; fi +pushd %{buildroot} +if [ -d usr/lib ]; then + find usr/lib -type f -printf "/%h/%f\n" >> filelist.lst +fi +if [ -d usr/lib64 ]; then + find usr/lib64 -type f -printf "/%h/%f\n" >> filelist.lst +fi +if [ -d usr/bin ]; then + find usr/bin -type f -printf "/%h/%f\n" >> filelist.lst +fi +if [ -d usr/sbin ]; then + find usr/sbin -type f -printf "/%h/%f\n" >> filelist.lst +fi +touch doclist.lst +if [ -d usr/share/man ]; then + find usr/share/man -type f -printf "/%h/%f.gz\n" >> doclist.lst +fi +popd +mv %{buildroot}/filelist.lst . +mv %{buildroot}/doclist.lst . + +%files -n python3-django-prometheus -f filelist.lst +%dir %{python3_sitelib}/* + +%files help -f doclist.lst +%{_docdir}/* + +%changelog +* Thu Mar 09 2023 Python_Bot <Python_Bot@openeuler.org> - 2.2.0-1 +- Package Spec generated @@ -0,0 +1 @@ +f37175407fd40bd97fc863f64e6816a6 django-prometheus-2.2.0.tar.gz |