1
2
3
4
5
6
7
8
9
10
11
12
13
14
15
16
17
18
19
20
21
22
23
24
25
26
27
28
29
30
31
32
33
34
35
36
37
38
39
40
41
42
43
44
45
46
47
48
49
50
51
52
53
54
55
56
57
58
59
60
61
62
63
64
65
66
67
68
69
70
71
72
73
74
75
76
77
78
79
80
81
82
83
84
85
86
87
88
89
90
91
92
93
94
95
96
97
98
99
100
101
102
103
104
105
106
107
108
109
110
111
112
113
114
115
116
117
118
119
120
121
122
123
124
125
126
127
128
129
130
131
132
133
134
135
136
137
138
139
140
141
142
143
144
145
146
147
148
149
150
151
152
153
154
155
156
157
158
159
160
161
162
163
164
165
166
167
168
169
170
171
172
173
174
175
176
177
178
179
180
181
182
183
184
185
186
187
188
189
190
191
192
193
194
195
196
197
198
199
200
201
202
203
204
205
206
207
208
209
210
211
212
213
214
215
216
217
218
219
220
221
222
223
224
225
226
227
228
229
230
231
232
233
234
235
236
237
238
239
240
241
242
243
244
245
246
247
248
249
250
251
252
253
254
255
256
257
258
259
260
261
262
263
264
265
266
267
268
269
270
271
272
273
274
275
276
277
278
279
280
281
282
283
284
285
286
287
288
289
290
291
292
293
294
295
296
297
298
299
300
301
302
303
304
305
306
307
308
309
310
311
312
313
314
315
316
317
318
319
320
321
322
323
324
325
326
327
328
329
330
331
332
333
334
335
336
337
338
339
340
341
342
343
344
345
346
347
348
349
350
351
352
353
354
355
356
357
358
359
360
361
362
363
364
365
366
367
368
369
370
371
372
373
374
375
376
377
378
379
380
381
382
383
384
385
386
387
388
389
390
391
392
393
394
395
396
397
398
399
400
401
402
403
404
405
406
407
408
409
410
411
412
413
414
415
416
417
418
419
420
421
422
423
424
425
426
427
428
429
430
431
432
433
434
435
436
|
%global _empty_manifest_terminate_build 0
Name: python-ipyplot
Version: 1.1.1
Release: 1
Summary: Simple package that leverages IPython and HTML for more efficient, reach and interactive plotting of images in Jupyter Notebooks
License: MIT
URL: http://github.com/karolzak/ipyplot
Source0: https://mirrors.nju.edu.cn/pypi/web/packages/6e/46/cf95ea520b0c7c57f789646ec21deb04005f54101636fc1533bf7d2a8664/ipyplot-1.1.1.tar.gz
BuildArch: noarch
Requires: python3-IPython
Requires: python3-numpy
Requires: python3-pillow
Requires: python3-shortuuid
%description
[](https://github.com/karolzak/ipyplot/actions?query=workflow%3A%22CI+Build%22)
[](https://pypi.org/project/ipyplot/)
[](https://pepy.tech/project/ipyplot)
[](https://pepy.tech/project/ipyplot/month)
[](https://github.com/karolzak/ipyplot/blob/master/LICENSE)
**Share**:
[](http://twitter.com/share?text=IPyPlot%20-%20fast%20and%20effortless%20way%20to%20display%20huge%20numbers%20of%20images%20in%20Python%20notebooks&url=https://github.com/karolzak/ipyplot/&hashtags=python,computervision,imageclassification,deeplearning,ML,AI)
[](http://www.linkedin.com/shareArticle?mini=true&url=https://github.com/karolzak/ipyplot&title=IPyPlot%20python%20package)
**IPyPlot** is a small python package offering fast and efficient plotting of images inside Python Notebooks cells. It's using IPython with HTML for faster, richer and more interactive way of displaying big numbers of images.

Displaying big numbers of images with Python in Notebooks always was a big pain for me as I always used `matplotlib` for that task and never have I even considered if it can be done faster, easier or more efficiently.
Especially in one of my recent projects I had to work with a vast number of document images in a very interactive way which led me to forever rerunning notebook cells and waiting for countless seconds for `matplotlib` to do it's thing..
My frustration grew up to the point were I couldn't stand it anymore and started to look for other options..
Best solution I found involved using `IPython` package in connection with simple HTML. Using that approach I built this simple python package called **IPyPlot** which finally helped me cure my frustration and saved a lot of my time.
### Features:
- [x] Easy, fast and efficient plotting of images in python within notebooks
- [x] Plotting functions (see [examples section](#Usage-examples) to learn more):
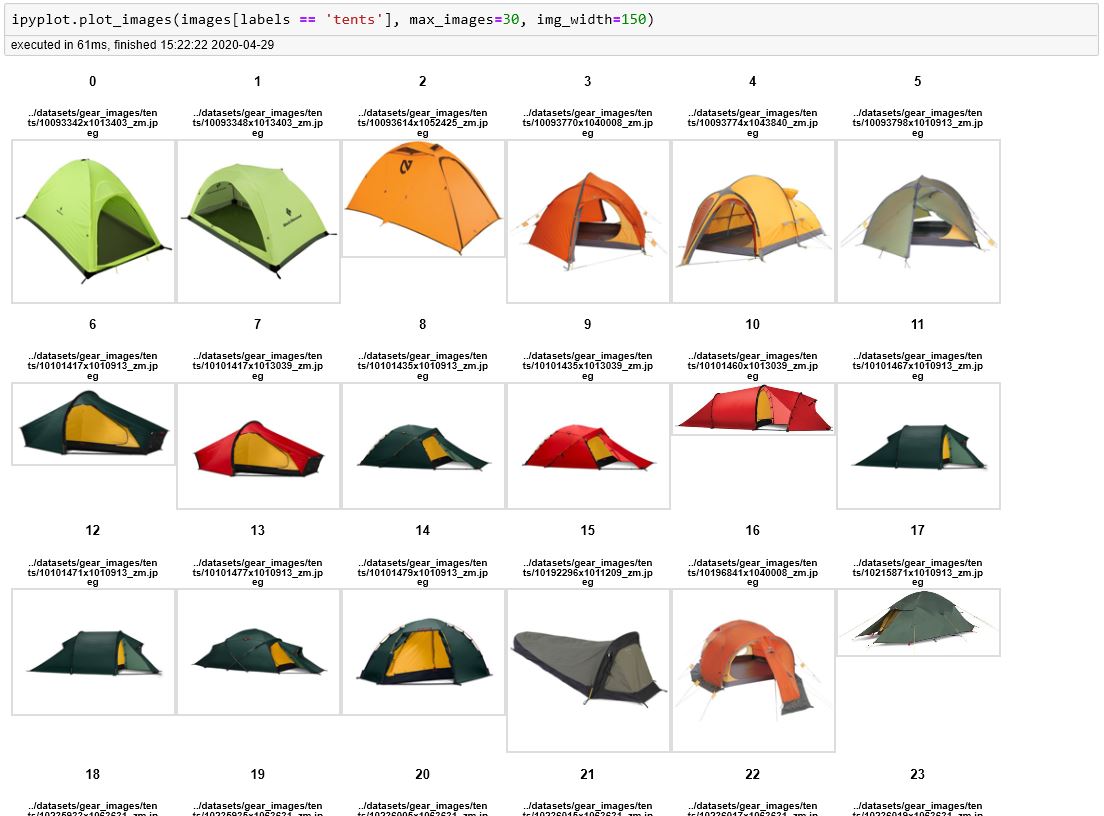
- [x] `plot_images` - simply plots all the images in a grid-like layout
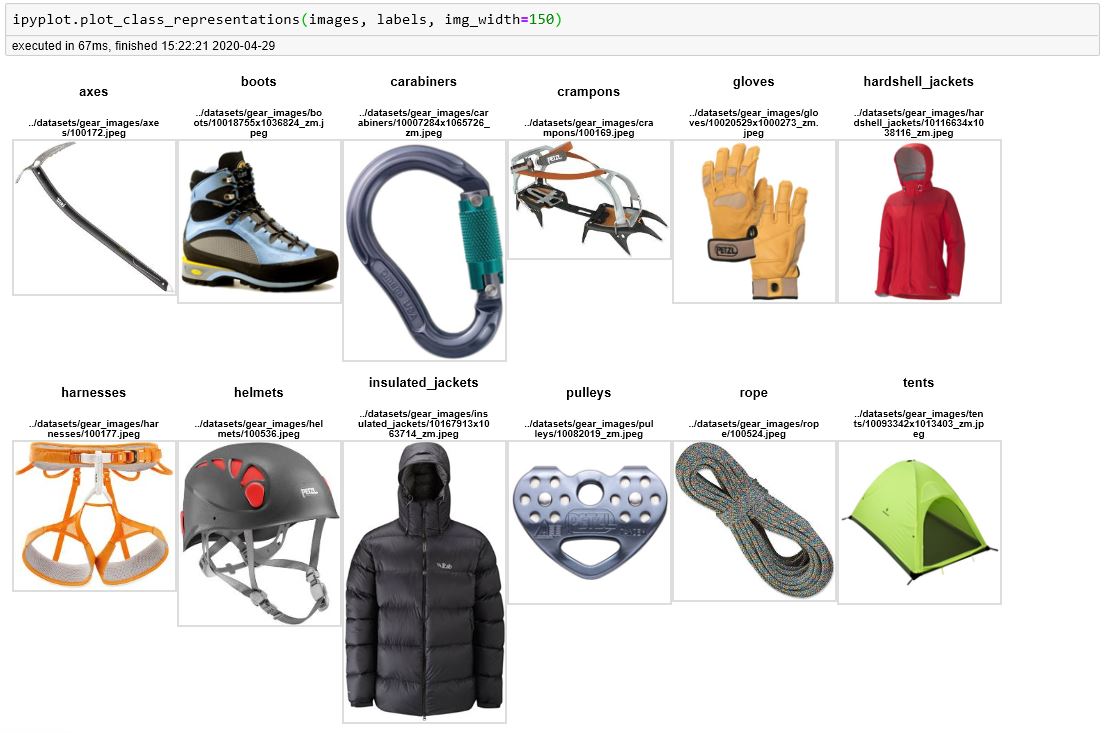
- [x] `plot_class_representations` - similar to `plot_images` but displays only the first image for each label/class (based on provided labels collection)
- [x] `plot_class_tabs` - plots images in a grid-like manner in a separate tab for each label/class based on provided labels
- [x] Supported image formats:
- [x] Sequence of local storage URLs, e.g. `[your/dir/img1.jpg]`
- [x] Sequence of remote URLs, e.g. `[http://yourimages.com/img1.jpg]`
- [x] Sequence of `PIL.Image` objects
- [x] Sequence of images as `numpy.ndarray` objects
- [x] Supported sequence types: `list`, `numpy.ndarray`, `pandas.Series`
- [x] Misc features:
- [x] `custom_texts` param to display additional texts like confidence score or some other information for each image
- [x] `force_b64` flag to force conversion of images from URLs to base64 format
- [x] click on image to enlarge
- [x] control number of displayed images and their width through `max_images` and `img_width` params
- [x] "show html" button which reveals the HTML code used to generate plots
- [x] option to set specific order of labels/tabs, filter them or ignore some of the labels
- [x] Supported notebook platforms:
- [x] Jupyter
- [x] Google Colab
- [x] Azure Notebooks
- [x] Kaggle Notebooks
## Getting Started
To start using IPyPlot, see [examples below](#Usage-examples) or go to
[gear-images-examples.ipynb](https://github.com/karolzak/ipyplot/blob/master/notebooks/gear-images-examples.ipynb) notebook which takes you through most of the scenarios and options possible with **IPyPlot**.
## Installation
**IPyPlot** can be installed through [PyPI](https://pypi.org/project/ipyplot/):
```
pip install ipyplot
```
or directly from this repo using `pip`:
```
pip install git+https://github.com/karolzak/ipyplot
```
## Usage examples
IPyPlot offers 3 main functions which can be used for displaying images in notebooks:
To start working with `IPyPlot` you need to simply import it like this:
```python
import ipyplot
```
and use any of the available plotting functions shown below (notice execution times).
- **images** - should be a sequence of either `string` (local or remote image file URLs), `PIL.Image` objects or `numpy.ndarray` objects representing images
- **labels** - should be a sequence of `string` or `int`
#### Display a collection of images
```python
images = [
"docs/example1-tabs.jpg",
"docs/example2-images.jpg",
"docs/example3-classes.jpg",
]
ipyplot.plot_images(images, max_images=30, img_width=150)
```
#### Display class representations (first image for each unique label)
```python
images = [
"docs/example1-tabs.jpg",
"docs/example2-images.jpg",
"docs/example3-classes.jpg",
]
labels = ['label1', 'label2', 'label3']
ipyplot.plot_class_representations(images, labels, img_width=150)
```
#### Display images in separate, interactive tabs for each unique class
```python
images = [
"docs/example1-tabs.jpg",
"docs/example2-images.jpg",
"docs/example3-classes.jpg",
]
labels = ['class1', 'class2', 'class3']
ipyplot.plot_class_tabs(images, labels, max_images_per_tab=10, img_width=150)
```

To learn more about what you can do with IPyPlot go to [gear-images-examples.ipynb](https://github.com/karolzak/ipyplot/blob/master/notebooks/gear-images-examples.ipynb) notebook for more complex examples.
%package -n python3-ipyplot
Summary: Simple package that leverages IPython and HTML for more efficient, reach and interactive plotting of images in Jupyter Notebooks
Provides: python-ipyplot
BuildRequires: python3-devel
BuildRequires: python3-setuptools
BuildRequires: python3-pip
%description -n python3-ipyplot
[](https://github.com/karolzak/ipyplot/actions?query=workflow%3A%22CI+Build%22)
[](https://pypi.org/project/ipyplot/)
[](https://pepy.tech/project/ipyplot)
[](https://pepy.tech/project/ipyplot/month)
[](https://github.com/karolzak/ipyplot/blob/master/LICENSE)
**Share**:
[](http://twitter.com/share?text=IPyPlot%20-%20fast%20and%20effortless%20way%20to%20display%20huge%20numbers%20of%20images%20in%20Python%20notebooks&url=https://github.com/karolzak/ipyplot/&hashtags=python,computervision,imageclassification,deeplearning,ML,AI)
[](http://www.linkedin.com/shareArticle?mini=true&url=https://github.com/karolzak/ipyplot&title=IPyPlot%20python%20package)
**IPyPlot** is a small python package offering fast and efficient plotting of images inside Python Notebooks cells. It's using IPython with HTML for faster, richer and more interactive way of displaying big numbers of images.

Displaying big numbers of images with Python in Notebooks always was a big pain for me as I always used `matplotlib` for that task and never have I even considered if it can be done faster, easier or more efficiently.
Especially in one of my recent projects I had to work with a vast number of document images in a very interactive way which led me to forever rerunning notebook cells and waiting for countless seconds for `matplotlib` to do it's thing..
My frustration grew up to the point were I couldn't stand it anymore and started to look for other options..
Best solution I found involved using `IPython` package in connection with simple HTML. Using that approach I built this simple python package called **IPyPlot** which finally helped me cure my frustration and saved a lot of my time.
### Features:
- [x] Easy, fast and efficient plotting of images in python within notebooks
- [x] Plotting functions (see [examples section](#Usage-examples) to learn more):
- [x] `plot_images` - simply plots all the images in a grid-like layout
- [x] `plot_class_representations` - similar to `plot_images` but displays only the first image for each label/class (based on provided labels collection)
- [x] `plot_class_tabs` - plots images in a grid-like manner in a separate tab for each label/class based on provided labels
- [x] Supported image formats:
- [x] Sequence of local storage URLs, e.g. `[your/dir/img1.jpg]`
- [x] Sequence of remote URLs, e.g. `[http://yourimages.com/img1.jpg]`
- [x] Sequence of `PIL.Image` objects
- [x] Sequence of images as `numpy.ndarray` objects
- [x] Supported sequence types: `list`, `numpy.ndarray`, `pandas.Series`
- [x] Misc features:
- [x] `custom_texts` param to display additional texts like confidence score or some other information for each image
- [x] `force_b64` flag to force conversion of images from URLs to base64 format
- [x] click on image to enlarge
- [x] control number of displayed images and their width through `max_images` and `img_width` params
- [x] "show html" button which reveals the HTML code used to generate plots
- [x] option to set specific order of labels/tabs, filter them or ignore some of the labels
- [x] Supported notebook platforms:
- [x] Jupyter
- [x] Google Colab
- [x] Azure Notebooks
- [x] Kaggle Notebooks
## Getting Started
To start using IPyPlot, see [examples below](#Usage-examples) or go to
[gear-images-examples.ipynb](https://github.com/karolzak/ipyplot/blob/master/notebooks/gear-images-examples.ipynb) notebook which takes you through most of the scenarios and options possible with **IPyPlot**.
## Installation
**IPyPlot** can be installed through [PyPI](https://pypi.org/project/ipyplot/):
```
pip install ipyplot
```
or directly from this repo using `pip`:
```
pip install git+https://github.com/karolzak/ipyplot
```
## Usage examples
IPyPlot offers 3 main functions which can be used for displaying images in notebooks:
To start working with `IPyPlot` you need to simply import it like this:
```python
import ipyplot
```
and use any of the available plotting functions shown below (notice execution times).
- **images** - should be a sequence of either `string` (local or remote image file URLs), `PIL.Image` objects or `numpy.ndarray` objects representing images
- **labels** - should be a sequence of `string` or `int`
#### Display a collection of images
```python
images = [
"docs/example1-tabs.jpg",
"docs/example2-images.jpg",
"docs/example3-classes.jpg",
]
ipyplot.plot_images(images, max_images=30, img_width=150)
```

#### Display class representations (first image for each unique label)
```python
images = [
"docs/example1-tabs.jpg",
"docs/example2-images.jpg",
"docs/example3-classes.jpg",
]
labels = ['label1', 'label2', 'label3']
ipyplot.plot_class_representations(images, labels, img_width=150)
```

#### Display images in separate, interactive tabs for each unique class
```python
images = [
"docs/example1-tabs.jpg",
"docs/example2-images.jpg",
"docs/example3-classes.jpg",
]
labels = ['class1', 'class2', 'class3']
ipyplot.plot_class_tabs(images, labels, max_images_per_tab=10, img_width=150)
```

To learn more about what you can do with IPyPlot go to [gear-images-examples.ipynb](https://github.com/karolzak/ipyplot/blob/master/notebooks/gear-images-examples.ipynb) notebook for more complex examples.
%package help
Summary: Development documents and examples for ipyplot
Provides: python3-ipyplot-doc
%description help
[](https://github.com/karolzak/ipyplot/actions?query=workflow%3A%22CI+Build%22)
[](https://pypi.org/project/ipyplot/)
[](https://pepy.tech/project/ipyplot)
[](https://pepy.tech/project/ipyplot/month)
[](https://github.com/karolzak/ipyplot/blob/master/LICENSE)
**Share**:
[](http://twitter.com/share?text=IPyPlot%20-%20fast%20and%20effortless%20way%20to%20display%20huge%20numbers%20of%20images%20in%20Python%20notebooks&url=https://github.com/karolzak/ipyplot/&hashtags=python,computervision,imageclassification,deeplearning,ML,AI)
[](http://www.linkedin.com/shareArticle?mini=true&url=https://github.com/karolzak/ipyplot&title=IPyPlot%20python%20package)
**IPyPlot** is a small python package offering fast and efficient plotting of images inside Python Notebooks cells. It's using IPython with HTML for faster, richer and more interactive way of displaying big numbers of images.

Displaying big numbers of images with Python in Notebooks always was a big pain for me as I always used `matplotlib` for that task and never have I even considered if it can be done faster, easier or more efficiently.
Especially in one of my recent projects I had to work with a vast number of document images in a very interactive way which led me to forever rerunning notebook cells and waiting for countless seconds for `matplotlib` to do it's thing..
My frustration grew up to the point were I couldn't stand it anymore and started to look for other options..
Best solution I found involved using `IPython` package in connection with simple HTML. Using that approach I built this simple python package called **IPyPlot** which finally helped me cure my frustration and saved a lot of my time.
### Features:
- [x] Easy, fast and efficient plotting of images in python within notebooks
- [x] Plotting functions (see [examples section](#Usage-examples) to learn more):
- [x] `plot_images` - simply plots all the images in a grid-like layout
- [x] `plot_class_representations` - similar to `plot_images` but displays only the first image for each label/class (based on provided labels collection)
- [x] `plot_class_tabs` - plots images in a grid-like manner in a separate tab for each label/class based on provided labels
- [x] Supported image formats:
- [x] Sequence of local storage URLs, e.g. `[your/dir/img1.jpg]`
- [x] Sequence of remote URLs, e.g. `[http://yourimages.com/img1.jpg]`
- [x] Sequence of `PIL.Image` objects
- [x] Sequence of images as `numpy.ndarray` objects
- [x] Supported sequence types: `list`, `numpy.ndarray`, `pandas.Series`
- [x] Misc features:
- [x] `custom_texts` param to display additional texts like confidence score or some other information for each image
- [x] `force_b64` flag to force conversion of images from URLs to base64 format
- [x] click on image to enlarge
- [x] control number of displayed images and their width through `max_images` and `img_width` params
- [x] "show html" button which reveals the HTML code used to generate plots
- [x] option to set specific order of labels/tabs, filter them or ignore some of the labels
- [x] Supported notebook platforms:
- [x] Jupyter
- [x] Google Colab
- [x] Azure Notebooks
- [x] Kaggle Notebooks
## Getting Started
To start using IPyPlot, see [examples below](#Usage-examples) or go to
[gear-images-examples.ipynb](https://github.com/karolzak/ipyplot/blob/master/notebooks/gear-images-examples.ipynb) notebook which takes you through most of the scenarios and options possible with **IPyPlot**.
## Installation
**IPyPlot** can be installed through [PyPI](https://pypi.org/project/ipyplot/):
```
pip install ipyplot
```
or directly from this repo using `pip`:
```
pip install git+https://github.com/karolzak/ipyplot
```
## Usage examples
IPyPlot offers 3 main functions which can be used for displaying images in notebooks:
To start working with `IPyPlot` you need to simply import it like this:
```python
import ipyplot
```
and use any of the available plotting functions shown below (notice execution times).
- **images** - should be a sequence of either `string` (local or remote image file URLs), `PIL.Image` objects or `numpy.ndarray` objects representing images
- **labels** - should be a sequence of `string` or `int`
#### Display a collection of images
```python
images = [
"docs/example1-tabs.jpg",
"docs/example2-images.jpg",
"docs/example3-classes.jpg",
]
ipyplot.plot_images(images, max_images=30, img_width=150)
```

#### Display class representations (first image for each unique label)
```python
images = [
"docs/example1-tabs.jpg",
"docs/example2-images.jpg",
"docs/example3-classes.jpg",
]
labels = ['label1', 'label2', 'label3']
ipyplot.plot_class_representations(images, labels, img_width=150)
```

#### Display images in separate, interactive tabs for each unique class
```python
images = [
"docs/example1-tabs.jpg",
"docs/example2-images.jpg",
"docs/example3-classes.jpg",
]
labels = ['class1', 'class2', 'class3']
ipyplot.plot_class_tabs(images, labels, max_images_per_tab=10, img_width=150)
```

To learn more about what you can do with IPyPlot go to [gear-images-examples.ipynb](https://github.com/karolzak/ipyplot/blob/master/notebooks/gear-images-examples.ipynb) notebook for more complex examples.
%prep
%autosetup -n ipyplot-1.1.1
%build
%py3_build
%install
%py3_install
install -d -m755 %{buildroot}/%{_pkgdocdir}
if [ -d doc ]; then cp -arf doc %{buildroot}/%{_pkgdocdir}; fi
if [ -d docs ]; then cp -arf docs %{buildroot}/%{_pkgdocdir}; fi
if [ -d example ]; then cp -arf example %{buildroot}/%{_pkgdocdir}; fi
if [ -d examples ]; then cp -arf examples %{buildroot}/%{_pkgdocdir}; fi
pushd %{buildroot}
if [ -d usr/lib ]; then
find usr/lib -type f -printf "/%h/%f\n" >> filelist.lst
fi
if [ -d usr/lib64 ]; then
find usr/lib64 -type f -printf "/%h/%f\n" >> filelist.lst
fi
if [ -d usr/bin ]; then
find usr/bin -type f -printf "/%h/%f\n" >> filelist.lst
fi
if [ -d usr/sbin ]; then
find usr/sbin -type f -printf "/%h/%f\n" >> filelist.lst
fi
touch doclist.lst
if [ -d usr/share/man ]; then
find usr/share/man -type f -printf "/%h/%f.gz\n" >> doclist.lst
fi
popd
mv %{buildroot}/filelist.lst .
mv %{buildroot}/doclist.lst .
%files -n python3-ipyplot -f filelist.lst
%dir %{python3_sitelib}/*
%files help -f doclist.lst
%{_docdir}/*
%changelog
* Fri May 05 2023 Python_Bot <Python_Bot@openeuler.org> - 1.1.1-1
- Package Spec generated
|
