
diff options
| author | CoprDistGit <infra@openeuler.org> | 2023-05-05 03:49:27 +0000 |
|---|---|---|
| committer | CoprDistGit <infra@openeuler.org> | 2023-05-05 03:49:27 +0000 |
| commit | 1b53b14ffc1bd03ff56ffda5c1daf4d9e110a198 (patch) | |
| tree | 108bc0c57ddf4a8d19de632c0764edc2235c2532 | |
| parent | 14cd6459c5d93d3fbf9802bb8d11b74ade87f452 (diff) | |
automatic import of python-meteostatopeneuler20.03
| -rw-r--r-- | .gitignore | 1 | ||||
| -rw-r--r-- | python-meteostat.spec | 348 | ||||
| -rw-r--r-- | sources | 1 |
3 files changed, 350 insertions, 0 deletions
@@ -0,0 +1 @@ +/meteostat-1.6.5.tar.gz diff --git a/python-meteostat.spec b/python-meteostat.spec new file mode 100644 index 0000000..87d4725 --- /dev/null +++ b/python-meteostat.spec @@ -0,0 +1,348 @@ +%global _empty_manifest_terminate_build 0 +Name: python-meteostat +Version: 1.6.5 +Release: 1 +Summary: Access and analyze historical weather and climate data with Python. +License: MIT +URL: https://github.com/meteostat/meteostat-python +Source0: https://mirrors.nju.edu.cn/pypi/web/packages/87/4e/7c657eaa0e11f76238ee87c157ff673ecd7a00a8f7cf177eb8e001cdf1b9/meteostat-1.6.5.tar.gz +BuildArch: noarch + +Requires: python3-pandas +Requires: python3-pytz +Requires: python3-numpy + +%description +# Meteostat Python Package + +The Meteostat Python library provides a simple API for accessing open weather and climate data. The historical observations and statistics are collected by [Meteostat](https://meteostat.net) from different public interfaces, most of which are governmental. + +Among the data sources are national weather services like the National Oceanic and Atmospheric Administration (NOAA) and Germany's national meteorological service (DWD). + +Are you looking for a **hosted solution**? Try our [JSON API](https://rapidapi.com/meteostat/api/meteostat/). + +## Installation + +The Meteostat Python package is available through [PyPI](https://pypi.org/project/meteostat/): + +```sh +pip install meteostat +``` + +Meteostat **requires Python 3.6** or higher. If you want to visualize data, please install Matplotlib, too. + +## Documentation + +The Meteostat Python library is divided into multiple classes which provide access to the actual data. The [documentation](https://dev.meteostat.net/python/) covers all aspects of the library: + +* **Selecting Locations** + * [Geographical Point](https://dev.meteostat.net/python/point.html) + * [Weather Stations](https://dev.meteostat.net/python/stations.html) +* **Time Series** + * [Hourly Data](https://dev.meteostat.net/python/hourly.html) + * [Daily Data](https://dev.meteostat.net/python/daily.html) + * [Monthly Data](https://dev.meteostat.net/python/monthly.html) +* **Miscellaneous Data** + * [Climate Normals](https://dev.meteostat.net/python/normals.html) +* **Library** + * [Contributing](https://dev.meteostat.net/python/contributing.html) + * [Formats & Units](https://dev.meteostat.net/formats.html) + * [Data Sources](https://dev.meteostat.net/sources.html) + * [Terms & License](https://dev.meteostat.net/terms.html) + +## Example + +Let's plot 2018 temperature data for Vancouver, BC: + +```python +# Import Meteostat library and dependencies +from datetime import datetime +import matplotlib.pyplot as plt +from meteostat import Point, Daily + +# Set time period +start = datetime(2018, 1, 1) +end = datetime(2018, 12, 31) + +# Create Point for Vancouver, BC +location = Point(49.2497, -123.1193, 70) + +# Get daily data for 2018 +data = Daily(location, start, end) +data = data.fetch() + +# Plot line chart including average, minimum and maximum temperature +data.plot(y=['tavg', 'tmin', 'tmax']) +plt.show() +``` + +Take a look at the expected output: + +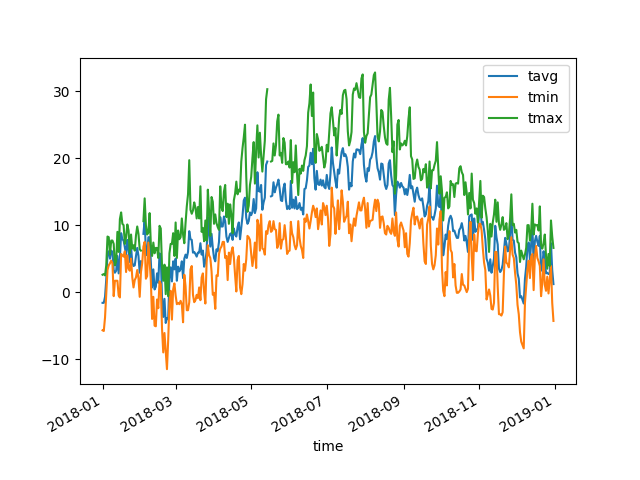 + +## Contributing + +Instructions on building and testing the Meteostat Python package can be found in the [documentation](https://dev.meteostat.net/python/contributing.html). More information about the Meteostat bulk data interface is available [here](https://dev.meteostat.net/bulk/). + +## Donating + +If you want to support the project financially, you can make a donation using one of the following services: + +* [GitHub](https://github.com/sponsors/clampr) +* [Patreon](https://www.patreon.com/meteostat) +* [PayPal](https://www.paypal.com/donate?hosted_button_id=MQ67WRDC8EW38) + +## Data License + +Meteorological data is provided under the terms of the [Creative Commons Attribution-NonCommercial 4.0 International Public License (CC BY-NC 4.0)](https://creativecommons.org/licenses/by-nc/4.0/legalcode). You may build upon the material +for any purpose, even commercially. However, you are not allowed to redistribute Meteostat data "as-is" for commercial purposes. + +By using the Meteostat Python library you agree to our [terms of service](https://dev.meteostat.net/terms.html). All meteorological data sources used by the Meteostat project are listed [here](https://dev.meteostat.net/sources.html). + +## Code License + +The code of this library is available under the [MIT license](https://opensource.org/licenses/MIT). + + + + +%package -n python3-meteostat +Summary: Access and analyze historical weather and climate data with Python. +Provides: python-meteostat +BuildRequires: python3-devel +BuildRequires: python3-setuptools +BuildRequires: python3-pip +%description -n python3-meteostat +# Meteostat Python Package + +The Meteostat Python library provides a simple API for accessing open weather and climate data. The historical observations and statistics are collected by [Meteostat](https://meteostat.net) from different public interfaces, most of which are governmental. + +Among the data sources are national weather services like the National Oceanic and Atmospheric Administration (NOAA) and Germany's national meteorological service (DWD). + +Are you looking for a **hosted solution**? Try our [JSON API](https://rapidapi.com/meteostat/api/meteostat/). + +## Installation + +The Meteostat Python package is available through [PyPI](https://pypi.org/project/meteostat/): + +```sh +pip install meteostat +``` + +Meteostat **requires Python 3.6** or higher. If you want to visualize data, please install Matplotlib, too. + +## Documentation + +The Meteostat Python library is divided into multiple classes which provide access to the actual data. The [documentation](https://dev.meteostat.net/python/) covers all aspects of the library: + +* **Selecting Locations** + * [Geographical Point](https://dev.meteostat.net/python/point.html) + * [Weather Stations](https://dev.meteostat.net/python/stations.html) +* **Time Series** + * [Hourly Data](https://dev.meteostat.net/python/hourly.html) + * [Daily Data](https://dev.meteostat.net/python/daily.html) + * [Monthly Data](https://dev.meteostat.net/python/monthly.html) +* **Miscellaneous Data** + * [Climate Normals](https://dev.meteostat.net/python/normals.html) +* **Library** + * [Contributing](https://dev.meteostat.net/python/contributing.html) + * [Formats & Units](https://dev.meteostat.net/formats.html) + * [Data Sources](https://dev.meteostat.net/sources.html) + * [Terms & License](https://dev.meteostat.net/terms.html) + +## Example + +Let's plot 2018 temperature data for Vancouver, BC: + +```python +# Import Meteostat library and dependencies +from datetime import datetime +import matplotlib.pyplot as plt +from meteostat import Point, Daily + +# Set time period +start = datetime(2018, 1, 1) +end = datetime(2018, 12, 31) + +# Create Point for Vancouver, BC +location = Point(49.2497, -123.1193, 70) + +# Get daily data for 2018 +data = Daily(location, start, end) +data = data.fetch() + +# Plot line chart including average, minimum and maximum temperature +data.plot(y=['tavg', 'tmin', 'tmax']) +plt.show() +``` + +Take a look at the expected output: + + + +## Contributing + +Instructions on building and testing the Meteostat Python package can be found in the [documentation](https://dev.meteostat.net/python/contributing.html). More information about the Meteostat bulk data interface is available [here](https://dev.meteostat.net/bulk/). + +## Donating + +If you want to support the project financially, you can make a donation using one of the following services: + +* [GitHub](https://github.com/sponsors/clampr) +* [Patreon](https://www.patreon.com/meteostat) +* [PayPal](https://www.paypal.com/donate?hosted_button_id=MQ67WRDC8EW38) + +## Data License + +Meteorological data is provided under the terms of the [Creative Commons Attribution-NonCommercial 4.0 International Public License (CC BY-NC 4.0)](https://creativecommons.org/licenses/by-nc/4.0/legalcode). You may build upon the material +for any purpose, even commercially. However, you are not allowed to redistribute Meteostat data "as-is" for commercial purposes. + +By using the Meteostat Python library you agree to our [terms of service](https://dev.meteostat.net/terms.html). All meteorological data sources used by the Meteostat project are listed [here](https://dev.meteostat.net/sources.html). + +## Code License + +The code of this library is available under the [MIT license](https://opensource.org/licenses/MIT). + + + + +%package help +Summary: Development documents and examples for meteostat +Provides: python3-meteostat-doc +%description help +# Meteostat Python Package + +The Meteostat Python library provides a simple API for accessing open weather and climate data. The historical observations and statistics are collected by [Meteostat](https://meteostat.net) from different public interfaces, most of which are governmental. + +Among the data sources are national weather services like the National Oceanic and Atmospheric Administration (NOAA) and Germany's national meteorological service (DWD). + +Are you looking for a **hosted solution**? Try our [JSON API](https://rapidapi.com/meteostat/api/meteostat/). + +## Installation + +The Meteostat Python package is available through [PyPI](https://pypi.org/project/meteostat/): + +```sh +pip install meteostat +``` + +Meteostat **requires Python 3.6** or higher. If you want to visualize data, please install Matplotlib, too. + +## Documentation + +The Meteostat Python library is divided into multiple classes which provide access to the actual data. The [documentation](https://dev.meteostat.net/python/) covers all aspects of the library: + +* **Selecting Locations** + * [Geographical Point](https://dev.meteostat.net/python/point.html) + * [Weather Stations](https://dev.meteostat.net/python/stations.html) +* **Time Series** + * [Hourly Data](https://dev.meteostat.net/python/hourly.html) + * [Daily Data](https://dev.meteostat.net/python/daily.html) + * [Monthly Data](https://dev.meteostat.net/python/monthly.html) +* **Miscellaneous Data** + * [Climate Normals](https://dev.meteostat.net/python/normals.html) +* **Library** + * [Contributing](https://dev.meteostat.net/python/contributing.html) + * [Formats & Units](https://dev.meteostat.net/formats.html) + * [Data Sources](https://dev.meteostat.net/sources.html) + * [Terms & License](https://dev.meteostat.net/terms.html) + +## Example + +Let's plot 2018 temperature data for Vancouver, BC: + +```python +# Import Meteostat library and dependencies +from datetime import datetime +import matplotlib.pyplot as plt +from meteostat import Point, Daily + +# Set time period +start = datetime(2018, 1, 1) +end = datetime(2018, 12, 31) + +# Create Point for Vancouver, BC +location = Point(49.2497, -123.1193, 70) + +# Get daily data for 2018 +data = Daily(location, start, end) +data = data.fetch() + +# Plot line chart including average, minimum and maximum temperature +data.plot(y=['tavg', 'tmin', 'tmax']) +plt.show() +``` + +Take a look at the expected output: + + + +## Contributing + +Instructions on building and testing the Meteostat Python package can be found in the [documentation](https://dev.meteostat.net/python/contributing.html). More information about the Meteostat bulk data interface is available [here](https://dev.meteostat.net/bulk/). + +## Donating + +If you want to support the project financially, you can make a donation using one of the following services: + +* [GitHub](https://github.com/sponsors/clampr) +* [Patreon](https://www.patreon.com/meteostat) +* [PayPal](https://www.paypal.com/donate?hosted_button_id=MQ67WRDC8EW38) + +## Data License + +Meteorological data is provided under the terms of the [Creative Commons Attribution-NonCommercial 4.0 International Public License (CC BY-NC 4.0)](https://creativecommons.org/licenses/by-nc/4.0/legalcode). You may build upon the material +for any purpose, even commercially. However, you are not allowed to redistribute Meteostat data "as-is" for commercial purposes. + +By using the Meteostat Python library you agree to our [terms of service](https://dev.meteostat.net/terms.html). All meteorological data sources used by the Meteostat project are listed [here](https://dev.meteostat.net/sources.html). + +## Code License + +The code of this library is available under the [MIT license](https://opensource.org/licenses/MIT). + + + + +%prep +%autosetup -n meteostat-1.6.5 + +%build +%py3_build + +%install +%py3_install +install -d -m755 %{buildroot}/%{_pkgdocdir} +if [ -d doc ]; then cp -arf doc %{buildroot}/%{_pkgdocdir}; fi +if [ -d docs ]; then cp -arf docs %{buildroot}/%{_pkgdocdir}; fi +if [ -d example ]; then cp -arf example %{buildroot}/%{_pkgdocdir}; fi +if [ -d examples ]; then cp -arf examples %{buildroot}/%{_pkgdocdir}; fi +pushd %{buildroot} +if [ -d usr/lib ]; then + find usr/lib -type f -printf "/%h/%f\n" >> filelist.lst +fi +if [ -d usr/lib64 ]; then + find usr/lib64 -type f -printf "/%h/%f\n" >> filelist.lst +fi +if [ -d usr/bin ]; then + find usr/bin -type f -printf "/%h/%f\n" >> filelist.lst +fi +if [ -d usr/sbin ]; then + find usr/sbin -type f -printf "/%h/%f\n" >> filelist.lst +fi +touch doclist.lst +if [ -d usr/share/man ]; then + find usr/share/man -type f -printf "/%h/%f.gz\n" >> doclist.lst +fi +popd +mv %{buildroot}/filelist.lst . +mv %{buildroot}/doclist.lst . + +%files -n python3-meteostat -f filelist.lst +%dir %{python3_sitelib}/* + +%files help -f doclist.lst +%{_docdir}/* + +%changelog +* Fri May 05 2023 Python_Bot <Python_Bot@openeuler.org> - 1.6.5-1 +- Package Spec generated @@ -0,0 +1 @@ +09ed6bddd32899cdb99def6b082690e1 meteostat-1.6.5.tar.gz |