1
2
3
4
5
6
7
8
9
10
11
12
13
14
15
16
17
18
19
20
21
22
23
24
25
26
27
28
29
30
31
32
33
34
35
36
37
38
39
40
41
42
43
44
45
46
47
48
49
50
51
52
53
54
55
56
57
58
59
60
61
62
63
64
65
66
67
68
69
70
71
72
73
74
75
76
77
78
79
80
81
82
83
84
85
86
87
88
89
90
91
92
93
94
95
96
97
98
99
100
101
102
103
104
105
106
107
108
109
110
111
112
113
114
115
116
117
118
119
120
121
122
123
124
125
126
127
128
129
130
131
132
133
134
135
136
137
138
139
140
141
142
143
144
145
146
147
148
149
150
151
152
153
154
155
156
157
158
159
160
161
162
163
164
165
166
167
168
169
170
171
172
173
174
175
176
177
178
179
180
181
182
183
184
185
186
187
188
189
190
191
192
193
194
195
196
197
198
199
200
201
202
203
204
205
206
207
208
209
210
211
212
213
214
215
216
217
218
219
220
221
222
223
224
225
226
227
228
229
230
231
232
233
234
235
236
237
238
239
240
241
242
243
244
245
246
247
248
249
250
251
252
253
254
255
256
257
258
259
260
261
262
263
264
265
266
267
268
269
270
271
272
273
274
275
276
277
278
279
280
281
282
283
284
285
286
287
288
289
290
291
292
293
294
295
296
297
298
299
300
301
302
303
304
305
306
307
308
309
310
311
312
313
314
315
316
317
318
319
320
321
322
323
324
325
326
327
328
329
330
331
332
333
334
335
336
337
338
339
340
341
342
343
344
345
346
347
348
349
350
351
352
353
354
355
356
357
358
359
360
361
362
363
364
365
366
367
368
369
370
371
372
373
374
375
376
377
378
379
380
381
382
383
384
385
386
387
388
389
390
391
392
393
394
395
396
397
398
399
400
401
402
403
404
405
406
407
408
409
410
411
412
413
414
415
416
417
418
419
420
421
422
423
424
425
426
427
428
429
430
431
432
433
434
435
436
437
438
439
440
441
442
443
444
445
446
447
448
449
450
451
452
453
454
455
456
457
458
459
460
461
462
463
464
465
466
467
468
469
470
471
472
473
474
475
476
477
478
479
480
481
482
483
484
485
486
487
488
489
490
491
492
493
494
495
496
497
498
499
500
501
502
503
504
505
506
507
508
509
510
511
512
513
514
515
516
517
518
519
520
521
522
523
524
525
526
527
528
529
530
531
532
533
534
535
536
537
538
539
540
541
542
543
544
545
546
547
548
549
550
551
552
553
554
555
556
557
558
559
560
561
562
563
564
565
566
567
568
569
570
571
572
573
574
575
576
577
578
579
580
581
582
583
584
585
586
587
588
589
590
591
592
593
594
595
596
597
598
599
600
601
602
603
604
605
606
607
608
609
610
611
612
613
614
615
616
617
618
619
620
621
622
623
624
625
626
627
628
629
630
631
632
633
634
635
636
637
638
639
640
641
642
643
644
645
646
647
648
649
650
651
652
653
654
655
656
657
658
659
660
661
662
663
664
665
666
667
668
669
670
671
672
673
674
675
676
677
678
679
680
681
682
683
684
685
686
687
688
689
690
691
692
693
694
695
696
697
698
699
700
701
702
703
704
705
706
707
708
709
710
711
712
|
%global _empty_manifest_terminate_build 0
Name: python-taiga-stats
Version: 1.6.0
Release: 1
Summary: Generate statistics from Taiga and produce burnup diagrams, CFDs, dependency graphs and more.
License: BSD-3-Clause
URL: https://github.com/erikw/taiga-stats
Source0: https://mirrors.nju.edu.cn/pypi/web/packages/96/24/9db7921eca063263b4f0744432136eae2f850018d8bde5344abda11fec61/taiga-stats-1.6.0.tar.gz
BuildArch: noarch
Requires: python3-matplotlib
Requires: python3-numpy
Requires: python3-taiga
Requires: python3-single-source
%description
# Taiga Stats - Your Taiga Statistics Tool [](https://twitter.com/intent/tweet?text=Scrum%20and%20Kanban%20masters;%20generate%20statistics%20from%20your%20Taiga.io%20projects%20with%20this%20python%20tool&url=https://github.com/erikw/jekyll-glossary_tooltip&via=erik_westrup&hashtags=taiga,scrum,kanban,statistics)
[](https://badge.fury.io/py/taiga-stats)
[](https://pepy.tech/project/taiga-stats)
[](https://taiga-stats.readthedocs.io/)
[](#)
[](https://app.travis-ci.com/github/erikw/taiga-stats)
[](https://github.com/erikw/taiga-stats/actions/workflows/linter.yml)
[](#)
[](https://github.com/erikw/taiga-stats/blob/main/LICENSE)
[](https://github.com/Netflix/osstracker)
This is a script for all you Scrum||Kanban masters out there who use Taiga and are interested in visualizing progress and generate some automated statistics and graphs.
[Taiga](https://taiga.io/) is an Open Source virtual Scrum and Kanban board that is popular for managing projects and work. We use a physical whiteboard at work but I mirror the status of stories in Taiga so that I can collect some statistics and generate diagrams and graphs using this tool I wrote.
# Features
```console
$ taiga-stats --help
usage: taiga-stats [-h] [-v] [--url URL] [--auth-token AUTH_TOKEN]
{config_template,list_projects,list_us_statuses,burnup,store_daily,points_sum,cfd,deps_dot_nodes,deps_dot}
...
Taiga statistic tool. Default values for many options can be set config file;
see the command 'config_template'.
positional arguments:
{config_template,list_projects,list_us_statuses,burnup,store_daily,points_sum,cfd,deps_dot_nodes,deps_dot}
Commands. Run $(taiga-stats <command> -h) for more
info about a command.
config_template Generate a template configuration file.
list_projects List all found project IDs and names on the server
that you have access to read.
list_us_statuses List all the ID and names of User Story statuses.
burnup Print burn(up|down) statistics. Typically used for
entering in an Excel sheet or such that plots a
burnup.
store_daily Store the current state of a project on file so that
the CFD command can generate a diagram with this data.
points_sum Print out the sum of points in User Story statuses.
cfd Generate a Cumulative Flow Diagram from stored data.
deps_dot_nodes Print User Story nodes in .dot file format.
deps_dot Print US in .dot file format with dependencies too!
Create a custom attribute for User Stories named
'Depends On' by going to Settings>Attributes>Custom
Fields. Then go to a User Story and put in a comma
separated list of stories that this story depends on
e.g. '#123,#456'.
optional arguments:
-h, --help show this help message and exit
-v, --version show program's version number and exit
--url URL URL to Taiga server.
--auth-token AUTH_TOKEN
Authentication token. Instructions on how to get one
is found at
https://docs.taiga.io/api.html#_authentication
Support: please go to https://github.com/erikw/taiga-stats/issues
```
# Terminology
* *US* - User Story
* *CFD* - Cumulative Flow Diagram
## Cumulative Flow Diagram
From a [CFD](http://brodzinski.com/2013/07/cumulative-flow-diagram.html) a lot of interesting insights about your team's progress [can be found](http://paulklipp.com/images/Interpreting_a_Cumulative_Flow_Diagram.jpg). However I'm not found of repetitive work like counting and entering numbers in an Excel sheet. This had to be automated! Therefore I deiced to write this script to save data on a daily basis with a cron job and a function for generating this diagram. This diagram can the be put on a TV visible in the hallways.
This is an example diagram generated from [mock data](https://github.com/erikw/taiga-stats/tree/main/sample_data/cfd_example.dat):
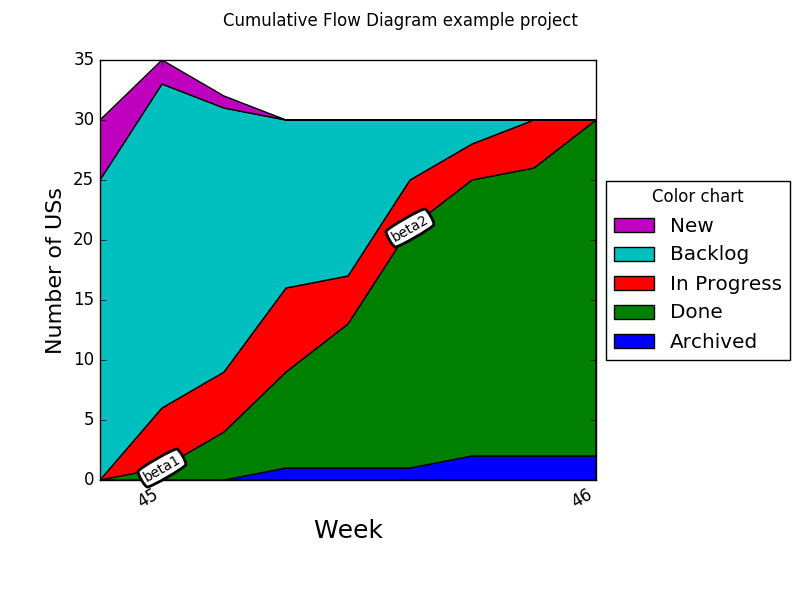
Textual annotations can be put in the plot by manually editing the `.dat file`.
Also a target date for the project deadline can be specified. Then a line will be drawn showing the ideal work pace towards this date, as seen below where the target finish date is in week 46.
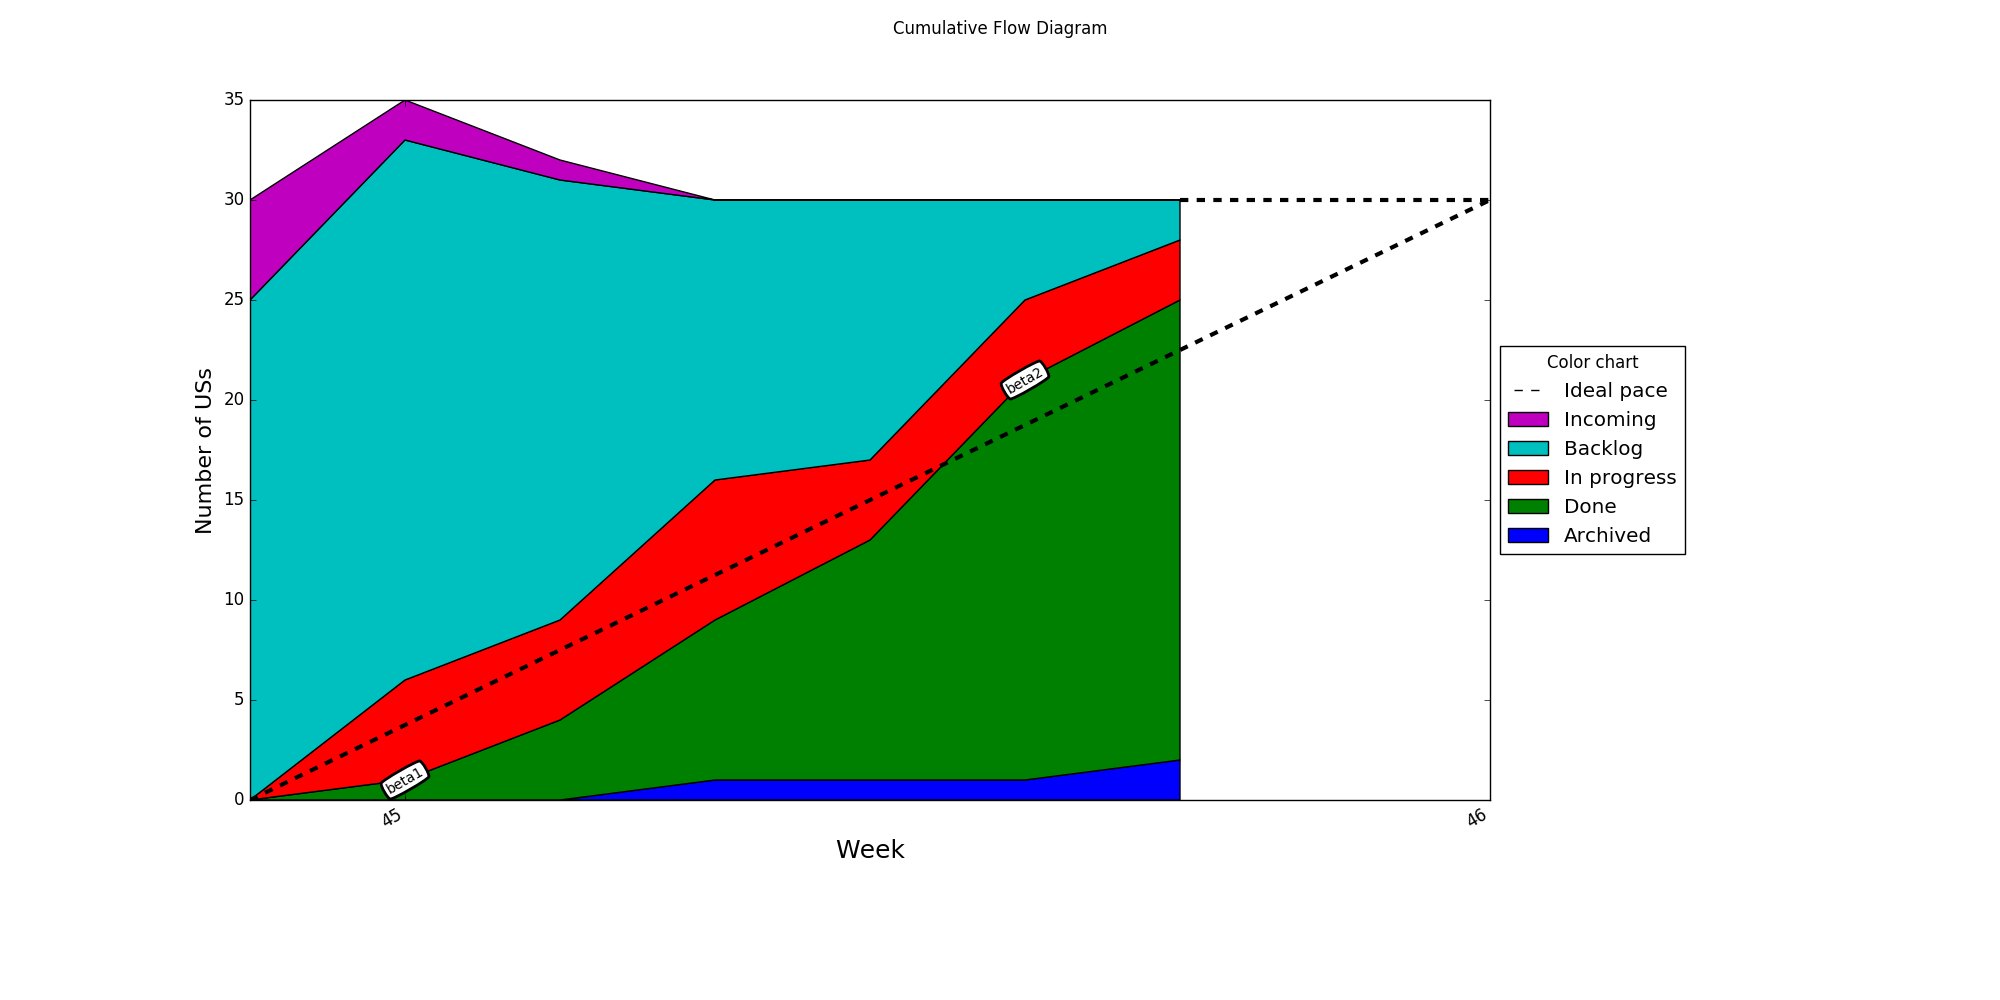
To save the data and generate the diagram each working day I have this cronjob:
```console
$ crontab -l | grep taiga
0 18 * * 1-5 $HOME/bin/taiga-stats-cron.sh
```
and the script `taiga-stats-cron.sh`:
```bash
#!/usr/bin/env sh
taiga-stats store_daily --tag some_feature_tag
taiga-stats cfd --tag some_feature_tag
```
## User Story Dependency Graph
Some stories requires other to be completed before they can be started. I thought it would be handy if you could keep track of these dependencies in Taiga but simply writing for each US a list of other stories that this story depends on. Then from this information a [.dot file](https://github.com/erikw/taiga-stats/tree/main/sample_data/dependencies_example.dot) can be generated that should how you user stories depends on each other. This graph is very useful for work planning i.e. what to start with and how much parallelization is possible and at what stages.
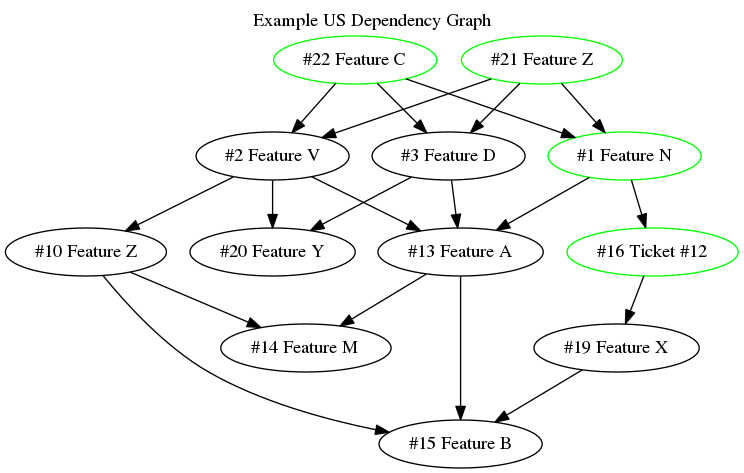
The stories that are marked as Done in Taiga have a green color in the graph.
### How to set up the dependency feature
First create a new custom filed in taiga named `Depends On` under Settings > Attributes > Custom Fields:
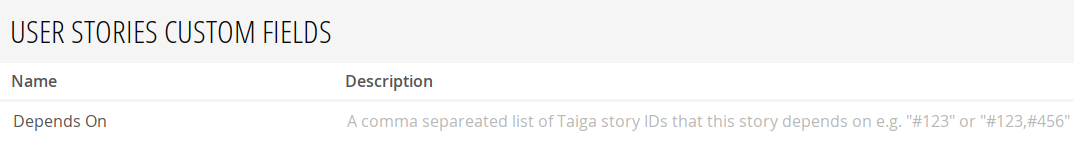
Then go to your User Stories and enter some dependencies as demonstrated below.
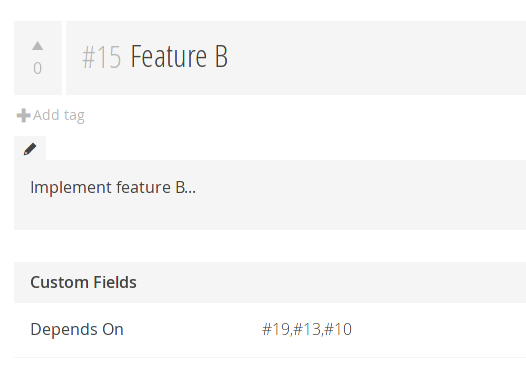
Then run the script and generate a PNG file.
```console
$ taiga-stats deps_dot
$ dot -T png -o ./dependencies.png ./dependencies.dot
```
# Setup
## Installation
Make sure to use a supported python version. See the key `python` in the section `tool.poetry.dependencies` at [pyproject.toml](https://github.com/erikw/taiga-stats/blob/main/pyproject.toml).
```console
$ pip install taiga-stats
$ taiga-stats -h
```
If you use [pipx](https://pypi.org/project/pipx/) to install, you must specify a supported and locally available python version like:
```console
$ pipx install --python python3.9 taiga-stats
```
To use this tool, you need to supply
* `--url` to your taiga server e.g. `https://api.taiga.io/`
* `--auth-token` that you need to obtain according to the [official instructions](https://docs.taiga.io/api.html#_authentication).
It's recommended to put these 2 values in the below described `taiga-stats.conf` file for easier usage of this tool!
## Config file
It is tedious to have to specify the server URL and the authentication token every time. Also you typically work with some project at a time and would like to have default values for the project to use and maybe which tag to filter on. You can generate a configuration file to set these default values.
```console
$ taiga-stats config_template
$ mv ./taiga.conf.template ~/.taiga-stats.conf
$ vi ~/.taiga-stats.conf
```
# Development
* Make sure to `$ poetry shell` before using tools like pyright LSP, so that it can find the installed dependency modules
* Reference for how to structure a python project: https://realpython.com/pypi-publish-python-package/
## Setup from Git
* Clone this git
```console
$ git clone https://github.com/erikw/taiga-stats.git && cd $(basename "$_" .git)
```
* Install Poetry
```console
$ pip install poetry
```
* Numpy install issues as of 2021-10-31
* `$ poetry install` did not work with Numpy on macOS. Solution from https://github.com/python-poetry/poetry/issues/3196#issuecomment-769753478
```console
$ pyenv local 3.9.7
$ poetry env use 3.9.7
$ poetry config experimental.new-installer false
$ poetry install
```
* Install project dependencies
```console
$ poetry install
```
* Now taiga-stats should work!
```console
$ poetry run taiga-stats -h
$ # or
$ bin/taiga-stats.sh
```
* To install locally:
```console
$ poetry build
$ pip install dist/taiga_stats-*.whl
```
# Development
## Documentation generation
```console
$ poetry run mkdocs serve
$ poetry run mkdocs build
```
but `bin/gen_docs.sh` will take care of all that plus more!
# Releasing
```console
$ bin/gen_docs.sh
$ vi CHANGELOG.md
$ poetry version minor && ver="v$(poetry version -s)"
$ git commit -am "Bump version to $ver" && git tag $ver && git push --atomic origin main $ver
$ poetry publish --build
```
%package -n python3-taiga-stats
Summary: Generate statistics from Taiga and produce burnup diagrams, CFDs, dependency graphs and more.
Provides: python-taiga-stats
BuildRequires: python3-devel
BuildRequires: python3-setuptools
BuildRequires: python3-pip
%description -n python3-taiga-stats
# Taiga Stats - Your Taiga Statistics Tool [](https://twitter.com/intent/tweet?text=Scrum%20and%20Kanban%20masters;%20generate%20statistics%20from%20your%20Taiga.io%20projects%20with%20this%20python%20tool&url=https://github.com/erikw/jekyll-glossary_tooltip&via=erik_westrup&hashtags=taiga,scrum,kanban,statistics)
[](https://badge.fury.io/py/taiga-stats)
[](https://pepy.tech/project/taiga-stats)
[](https://taiga-stats.readthedocs.io/)
[](#)
[](https://app.travis-ci.com/github/erikw/taiga-stats)
[](https://github.com/erikw/taiga-stats/actions/workflows/linter.yml)
[](#)
[](https://github.com/erikw/taiga-stats/blob/main/LICENSE)
[](https://github.com/Netflix/osstracker)
This is a script for all you Scrum||Kanban masters out there who use Taiga and are interested in visualizing progress and generate some automated statistics and graphs.
[Taiga](https://taiga.io/) is an Open Source virtual Scrum and Kanban board that is popular for managing projects and work. We use a physical whiteboard at work but I mirror the status of stories in Taiga so that I can collect some statistics and generate diagrams and graphs using this tool I wrote.
# Features
```console
$ taiga-stats --help
usage: taiga-stats [-h] [-v] [--url URL] [--auth-token AUTH_TOKEN]
{config_template,list_projects,list_us_statuses,burnup,store_daily,points_sum,cfd,deps_dot_nodes,deps_dot}
...
Taiga statistic tool. Default values for many options can be set config file;
see the command 'config_template'.
positional arguments:
{config_template,list_projects,list_us_statuses,burnup,store_daily,points_sum,cfd,deps_dot_nodes,deps_dot}
Commands. Run $(taiga-stats <command> -h) for more
info about a command.
config_template Generate a template configuration file.
list_projects List all found project IDs and names on the server
that you have access to read.
list_us_statuses List all the ID and names of User Story statuses.
burnup Print burn(up|down) statistics. Typically used for
entering in an Excel sheet or such that plots a
burnup.
store_daily Store the current state of a project on file so that
the CFD command can generate a diagram with this data.
points_sum Print out the sum of points in User Story statuses.
cfd Generate a Cumulative Flow Diagram from stored data.
deps_dot_nodes Print User Story nodes in .dot file format.
deps_dot Print US in .dot file format with dependencies too!
Create a custom attribute for User Stories named
'Depends On' by going to Settings>Attributes>Custom
Fields. Then go to a User Story and put in a comma
separated list of stories that this story depends on
e.g. '#123,#456'.
optional arguments:
-h, --help show this help message and exit
-v, --version show program's version number and exit
--url URL URL to Taiga server.
--auth-token AUTH_TOKEN
Authentication token. Instructions on how to get one
is found at
https://docs.taiga.io/api.html#_authentication
Support: please go to https://github.com/erikw/taiga-stats/issues
```
# Terminology
* *US* - User Story
* *CFD* - Cumulative Flow Diagram
## Cumulative Flow Diagram
From a [CFD](http://brodzinski.com/2013/07/cumulative-flow-diagram.html) a lot of interesting insights about your team's progress [can be found](http://paulklipp.com/images/Interpreting_a_Cumulative_Flow_Diagram.jpg). However I'm not found of repetitive work like counting and entering numbers in an Excel sheet. This had to be automated! Therefore I deiced to write this script to save data on a daily basis with a cron job and a function for generating this diagram. This diagram can the be put on a TV visible in the hallways.
This is an example diagram generated from [mock data](https://github.com/erikw/taiga-stats/tree/main/sample_data/cfd_example.dat):

Textual annotations can be put in the plot by manually editing the `.dat file`.
Also a target date for the project deadline can be specified. Then a line will be drawn showing the ideal work pace towards this date, as seen below where the target finish date is in week 46.

To save the data and generate the diagram each working day I have this cronjob:
```console
$ crontab -l | grep taiga
0 18 * * 1-5 $HOME/bin/taiga-stats-cron.sh
```
and the script `taiga-stats-cron.sh`:
```bash
#!/usr/bin/env sh
taiga-stats store_daily --tag some_feature_tag
taiga-stats cfd --tag some_feature_tag
```
## User Story Dependency Graph
Some stories requires other to be completed before they can be started. I thought it would be handy if you could keep track of these dependencies in Taiga but simply writing for each US a list of other stories that this story depends on. Then from this information a [.dot file](https://github.com/erikw/taiga-stats/tree/main/sample_data/dependencies_example.dot) can be generated that should how you user stories depends on each other. This graph is very useful for work planning i.e. what to start with and how much parallelization is possible and at what stages.

The stories that are marked as Done in Taiga have a green color in the graph.
### How to set up the dependency feature
First create a new custom filed in taiga named `Depends On` under Settings > Attributes > Custom Fields:

Then go to your User Stories and enter some dependencies as demonstrated below.

Then run the script and generate a PNG file.
```console
$ taiga-stats deps_dot
$ dot -T png -o ./dependencies.png ./dependencies.dot
```
# Setup
## Installation
Make sure to use a supported python version. See the key `python` in the section `tool.poetry.dependencies` at [pyproject.toml](https://github.com/erikw/taiga-stats/blob/main/pyproject.toml).
```console
$ pip install taiga-stats
$ taiga-stats -h
```
If you use [pipx](https://pypi.org/project/pipx/) to install, you must specify a supported and locally available python version like:
```console
$ pipx install --python python3.9 taiga-stats
```
To use this tool, you need to supply
* `--url` to your taiga server e.g. `https://api.taiga.io/`
* `--auth-token` that you need to obtain according to the [official instructions](https://docs.taiga.io/api.html#_authentication).
It's recommended to put these 2 values in the below described `taiga-stats.conf` file for easier usage of this tool!
## Config file
It is tedious to have to specify the server URL and the authentication token every time. Also you typically work with some project at a time and would like to have default values for the project to use and maybe which tag to filter on. You can generate a configuration file to set these default values.
```console
$ taiga-stats config_template
$ mv ./taiga.conf.template ~/.taiga-stats.conf
$ vi ~/.taiga-stats.conf
```
# Development
* Make sure to `$ poetry shell` before using tools like pyright LSP, so that it can find the installed dependency modules
* Reference for how to structure a python project: https://realpython.com/pypi-publish-python-package/
## Setup from Git
* Clone this git
```console
$ git clone https://github.com/erikw/taiga-stats.git && cd $(basename "$_" .git)
```
* Install Poetry
```console
$ pip install poetry
```
* Numpy install issues as of 2021-10-31
* `$ poetry install` did not work with Numpy on macOS. Solution from https://github.com/python-poetry/poetry/issues/3196#issuecomment-769753478
```console
$ pyenv local 3.9.7
$ poetry env use 3.9.7
$ poetry config experimental.new-installer false
$ poetry install
```
* Install project dependencies
```console
$ poetry install
```
* Now taiga-stats should work!
```console
$ poetry run taiga-stats -h
$ # or
$ bin/taiga-stats.sh
```
* To install locally:
```console
$ poetry build
$ pip install dist/taiga_stats-*.whl
```
# Development
## Documentation generation
```console
$ poetry run mkdocs serve
$ poetry run mkdocs build
```
but `bin/gen_docs.sh` will take care of all that plus more!
# Releasing
```console
$ bin/gen_docs.sh
$ vi CHANGELOG.md
$ poetry version minor && ver="v$(poetry version -s)"
$ git commit -am "Bump version to $ver" && git tag $ver && git push --atomic origin main $ver
$ poetry publish --build
```
%package help
Summary: Development documents and examples for taiga-stats
Provides: python3-taiga-stats-doc
%description help
# Taiga Stats - Your Taiga Statistics Tool [](https://twitter.com/intent/tweet?text=Scrum%20and%20Kanban%20masters;%20generate%20statistics%20from%20your%20Taiga.io%20projects%20with%20this%20python%20tool&url=https://github.com/erikw/jekyll-glossary_tooltip&via=erik_westrup&hashtags=taiga,scrum,kanban,statistics)
[](https://badge.fury.io/py/taiga-stats)
[](https://pepy.tech/project/taiga-stats)
[](https://taiga-stats.readthedocs.io/)
[](#)
[](https://app.travis-ci.com/github/erikw/taiga-stats)
[](https://github.com/erikw/taiga-stats/actions/workflows/linter.yml)
[](#)
[](https://github.com/erikw/taiga-stats/blob/main/LICENSE)
[](https://github.com/Netflix/osstracker)
This is a script for all you Scrum||Kanban masters out there who use Taiga and are interested in visualizing progress and generate some automated statistics and graphs.
[Taiga](https://taiga.io/) is an Open Source virtual Scrum and Kanban board that is popular for managing projects and work. We use a physical whiteboard at work but I mirror the status of stories in Taiga so that I can collect some statistics and generate diagrams and graphs using this tool I wrote.
# Features
```console
$ taiga-stats --help
usage: taiga-stats [-h] [-v] [--url URL] [--auth-token AUTH_TOKEN]
{config_template,list_projects,list_us_statuses,burnup,store_daily,points_sum,cfd,deps_dot_nodes,deps_dot}
...
Taiga statistic tool. Default values for many options can be set config file;
see the command 'config_template'.
positional arguments:
{config_template,list_projects,list_us_statuses,burnup,store_daily,points_sum,cfd,deps_dot_nodes,deps_dot}
Commands. Run $(taiga-stats <command> -h) for more
info about a command.
config_template Generate a template configuration file.
list_projects List all found project IDs and names on the server
that you have access to read.
list_us_statuses List all the ID and names of User Story statuses.
burnup Print burn(up|down) statistics. Typically used for
entering in an Excel sheet or such that plots a
burnup.
store_daily Store the current state of a project on file so that
the CFD command can generate a diagram with this data.
points_sum Print out the sum of points in User Story statuses.
cfd Generate a Cumulative Flow Diagram from stored data.
deps_dot_nodes Print User Story nodes in .dot file format.
deps_dot Print US in .dot file format with dependencies too!
Create a custom attribute for User Stories named
'Depends On' by going to Settings>Attributes>Custom
Fields. Then go to a User Story and put in a comma
separated list of stories that this story depends on
e.g. '#123,#456'.
optional arguments:
-h, --help show this help message and exit
-v, --version show program's version number and exit
--url URL URL to Taiga server.
--auth-token AUTH_TOKEN
Authentication token. Instructions on how to get one
is found at
https://docs.taiga.io/api.html#_authentication
Support: please go to https://github.com/erikw/taiga-stats/issues
```
# Terminology
* *US* - User Story
* *CFD* - Cumulative Flow Diagram
## Cumulative Flow Diagram
From a [CFD](http://brodzinski.com/2013/07/cumulative-flow-diagram.html) a lot of interesting insights about your team's progress [can be found](http://paulklipp.com/images/Interpreting_a_Cumulative_Flow_Diagram.jpg). However I'm not found of repetitive work like counting and entering numbers in an Excel sheet. This had to be automated! Therefore I deiced to write this script to save data on a daily basis with a cron job and a function for generating this diagram. This diagram can the be put on a TV visible in the hallways.
This is an example diagram generated from [mock data](https://github.com/erikw/taiga-stats/tree/main/sample_data/cfd_example.dat):

Textual annotations can be put in the plot by manually editing the `.dat file`.
Also a target date for the project deadline can be specified. Then a line will be drawn showing the ideal work pace towards this date, as seen below where the target finish date is in week 46.

To save the data and generate the diagram each working day I have this cronjob:
```console
$ crontab -l | grep taiga
0 18 * * 1-5 $HOME/bin/taiga-stats-cron.sh
```
and the script `taiga-stats-cron.sh`:
```bash
#!/usr/bin/env sh
taiga-stats store_daily --tag some_feature_tag
taiga-stats cfd --tag some_feature_tag
```
## User Story Dependency Graph
Some stories requires other to be completed before they can be started. I thought it would be handy if you could keep track of these dependencies in Taiga but simply writing for each US a list of other stories that this story depends on. Then from this information a [.dot file](https://github.com/erikw/taiga-stats/tree/main/sample_data/dependencies_example.dot) can be generated that should how you user stories depends on each other. This graph is very useful for work planning i.e. what to start with and how much parallelization is possible and at what stages.

The stories that are marked as Done in Taiga have a green color in the graph.
### How to set up the dependency feature
First create a new custom filed in taiga named `Depends On` under Settings > Attributes > Custom Fields:

Then go to your User Stories and enter some dependencies as demonstrated below.

Then run the script and generate a PNG file.
```console
$ taiga-stats deps_dot
$ dot -T png -o ./dependencies.png ./dependencies.dot
```
# Setup
## Installation
Make sure to use a supported python version. See the key `python` in the section `tool.poetry.dependencies` at [pyproject.toml](https://github.com/erikw/taiga-stats/blob/main/pyproject.toml).
```console
$ pip install taiga-stats
$ taiga-stats -h
```
If you use [pipx](https://pypi.org/project/pipx/) to install, you must specify a supported and locally available python version like:
```console
$ pipx install --python python3.9 taiga-stats
```
To use this tool, you need to supply
* `--url` to your taiga server e.g. `https://api.taiga.io/`
* `--auth-token` that you need to obtain according to the [official instructions](https://docs.taiga.io/api.html#_authentication).
It's recommended to put these 2 values in the below described `taiga-stats.conf` file for easier usage of this tool!
## Config file
It is tedious to have to specify the server URL and the authentication token every time. Also you typically work with some project at a time and would like to have default values for the project to use and maybe which tag to filter on. You can generate a configuration file to set these default values.
```console
$ taiga-stats config_template
$ mv ./taiga.conf.template ~/.taiga-stats.conf
$ vi ~/.taiga-stats.conf
```
# Development
* Make sure to `$ poetry shell` before using tools like pyright LSP, so that it can find the installed dependency modules
* Reference for how to structure a python project: https://realpython.com/pypi-publish-python-package/
## Setup from Git
* Clone this git
```console
$ git clone https://github.com/erikw/taiga-stats.git && cd $(basename "$_" .git)
```
* Install Poetry
```console
$ pip install poetry
```
* Numpy install issues as of 2021-10-31
* `$ poetry install` did not work with Numpy on macOS. Solution from https://github.com/python-poetry/poetry/issues/3196#issuecomment-769753478
```console
$ pyenv local 3.9.7
$ poetry env use 3.9.7
$ poetry config experimental.new-installer false
$ poetry install
```
* Install project dependencies
```console
$ poetry install
```
* Now taiga-stats should work!
```console
$ poetry run taiga-stats -h
$ # or
$ bin/taiga-stats.sh
```
* To install locally:
```console
$ poetry build
$ pip install dist/taiga_stats-*.whl
```
# Development
## Documentation generation
```console
$ poetry run mkdocs serve
$ poetry run mkdocs build
```
but `bin/gen_docs.sh` will take care of all that plus more!
# Releasing
```console
$ bin/gen_docs.sh
$ vi CHANGELOG.md
$ poetry version minor && ver="v$(poetry version -s)"
$ git commit -am "Bump version to $ver" && git tag $ver && git push --atomic origin main $ver
$ poetry publish --build
```
%prep
%autosetup -n taiga-stats-1.6.0
%build
%py3_build
%install
%py3_install
install -d -m755 %{buildroot}/%{_pkgdocdir}
if [ -d doc ]; then cp -arf doc %{buildroot}/%{_pkgdocdir}; fi
if [ -d docs ]; then cp -arf docs %{buildroot}/%{_pkgdocdir}; fi
if [ -d example ]; then cp -arf example %{buildroot}/%{_pkgdocdir}; fi
if [ -d examples ]; then cp -arf examples %{buildroot}/%{_pkgdocdir}; fi
pushd %{buildroot}
if [ -d usr/lib ]; then
find usr/lib -type f -printf "/%h/%f\n" >> filelist.lst
fi
if [ -d usr/lib64 ]; then
find usr/lib64 -type f -printf "/%h/%f\n" >> filelist.lst
fi
if [ -d usr/bin ]; then
find usr/bin -type f -printf "/%h/%f\n" >> filelist.lst
fi
if [ -d usr/sbin ]; then
find usr/sbin -type f -printf "/%h/%f\n" >> filelist.lst
fi
touch doclist.lst
if [ -d usr/share/man ]; then
find usr/share/man -type f -printf "/%h/%f.gz\n" >> doclist.lst
fi
popd
mv %{buildroot}/filelist.lst .
mv %{buildroot}/doclist.lst .
%files -n python3-taiga-stats -f filelist.lst
%dir %{python3_sitelib}/*
%files help -f doclist.lst
%{_docdir}/*
%changelog
* Tue May 30 2023 Python_Bot <Python_Bot@openeuler.org> - 1.6.0-1
- Package Spec generated
|
