1
2
3
4
5
6
7
8
9
10
11
12
13
14
15
16
17
18
19
20
21
22
23
24
25
26
27
28
29
30
31
32
33
34
35
36
37
38
39
40
41
42
43
44
45
46
47
48
49
50
51
52
53
54
55
56
57
58
59
60
61
62
63
64
65
66
67
68
69
70
71
72
73
74
75
76
77
78
79
80
81
82
83
84
85
86
87
88
89
90
91
92
93
94
95
96
97
98
99
100
101
102
103
104
105
106
107
108
109
110
111
112
113
114
115
116
117
118
119
120
121
122
123
124
125
126
127
128
129
130
131
132
133
134
135
136
137
138
139
140
141
142
143
144
145
146
147
148
149
150
151
152
153
154
155
156
157
158
159
160
161
162
163
164
165
166
167
168
169
170
171
172
173
174
175
176
177
178
179
180
181
182
183
184
185
186
187
188
189
190
191
192
193
194
195
196
197
198
199
200
201
202
203
204
205
206
207
208
209
210
211
212
213
214
215
216
217
218
219
220
221
222
223
224
225
226
227
228
229
230
231
232
233
234
235
236
237
238
239
240
241
242
243
244
245
246
247
248
249
250
251
252
253
254
255
256
257
258
259
260
261
262
263
264
265
266
267
268
269
270
271
272
273
274
275
276
277
278
279
280
281
282
283
284
285
286
287
288
289
290
291
292
293
294
295
296
297
298
299
300
301
302
303
304
305
306
307
308
309
310
311
312
313
314
315
316
317
318
319
320
321
322
323
324
325
326
327
328
329
330
331
|
%global _empty_manifest_terminate_build 0
Name: python-geojsoncontour
Version: 0.4.0
Release: 1
Summary: Convert matplotlib contour plots to geojson
License: MIT
URL: http://github.com/bartromgens/geojsoncontour
Source0: https://mirrors.nju.edu.cn/pypi/web/packages/32/79/916b4de820ba7aa7d09c4a189056521ee968996f68ab42fb46278f196855/geojsoncontour-0.4.0.tar.gz
BuildArch: noarch
Requires: python3-geojson
Requires: python3-numpy
Requires: python3-matplotlib
Requires: python3-xarray
%description
# geojsoncontour
[](https://travis-ci.org/bartromgens/geojsoncontour) [](https://badge.fury.io/py/geojsoncontour) [](https://coveralls.io/github/bartromgens/geojsoncontour?branch=master)
A Python 3 module to convert matplotlib contour plots to geojson. Supports both contour and contourf plots.
Designed to show geographical [contour plots](http://matplotlib.org/examples/pylab_examples/contour_demo.html),
created with [matplotlib/pyplot](https://github.com/matplotlib/matplotlib), as vector layer on interactive slippy maps like [OpenLayers](https://github.com/openlayers/ol3) and [Leaflet](https://github.com/Leaflet/Leaflet).
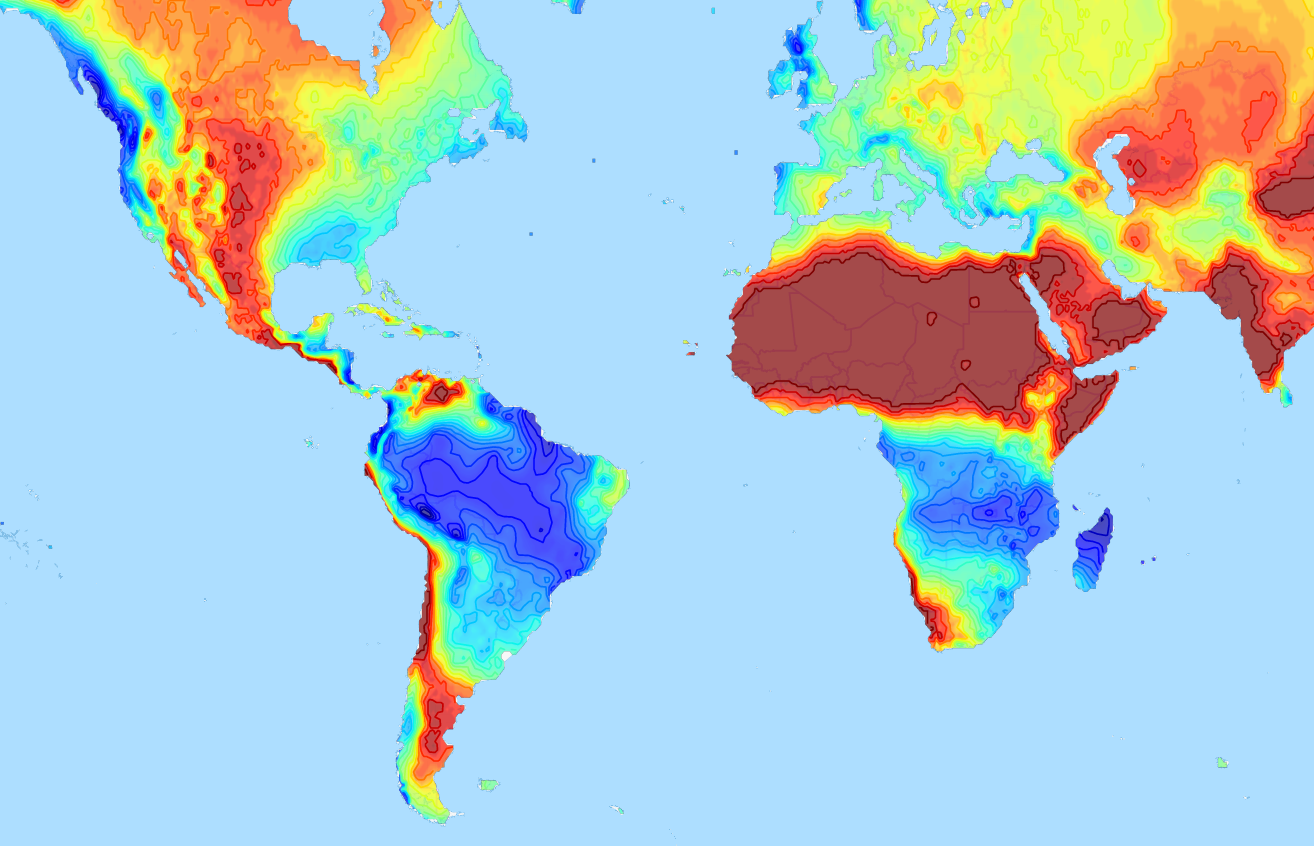
Demo project that uses geojsoncontour: [climatemaps.romgens.com](http://climatemaps.romgens.com)
## Installation
Install with pip,
```
pip install geojsoncontour
```
## Usage
Use `contour_to_geojson` to create a geojson with contour lines from a `matplotlib.contour` plot (not filled).
Use `contourf_to_geojson` to create a geojson with filled contours from a `matplotlib.contourf` plot.
### Contour plot to geojson
```python
import numpy
import matplotlib.pyplot as plt
import geojsoncontour
# Create contour data lon_range, lat_range, Z
<your code here>
# Create a contour plot plot from grid (lat, lon) data
figure = plt.figure()
ax = figure.add_subplot(111)
contour = ax.contour(lon_range, lat_range, Z, cmap=plt.cm.jet)
# Convert matplotlib contour to geojson
geojson = geojsoncontour.contour_to_geojson(
contour=contour,
ndigits=3,
unit='m'
)
```
For filled contour plots (`matplotlib.contourf`) use `contourf_to_geojson`.
See [example_contour.py](examples/example_contour.py) and [example_contourf.py](examples/example_contourf.py) for simple but complete examples.
### Show the geojson on a map
An easy way to show the generated geojson on a map is the online geojson renderer [geojson.io](http://geojson.io) or [geojson.tools](http://geojson.tools).
### Style properties
Stroke color and width are set as geojson properties following https://github.com/mapbox/simplestyle-spec.
### Create geojson tiles
Try [geojson-vt](https://github.com/mapbox/geojson-vt) or [tippecanoe](https://github.com/mapbox/tippecanoe) if performance is an issue and you need to tile your geojson contours.
## Development
### Tests
Run all tests,
```
python -m unittest discover
```
### Release
Install setuptools, wheel and twine:
```
python -m pip install --upgrade setuptools wheel twine
```
Increase the version number in `setup.py`.
Create dist:
```
python setup.py sdist bdist_wheel
```
Upload:
```
twine upload dist/*
```
%package -n python3-geojsoncontour
Summary: Convert matplotlib contour plots to geojson
Provides: python-geojsoncontour
BuildRequires: python3-devel
BuildRequires: python3-setuptools
BuildRequires: python3-pip
%description -n python3-geojsoncontour
# geojsoncontour
[](https://travis-ci.org/bartromgens/geojsoncontour) [](https://badge.fury.io/py/geojsoncontour) [](https://coveralls.io/github/bartromgens/geojsoncontour?branch=master)
A Python 3 module to convert matplotlib contour plots to geojson. Supports both contour and contourf plots.
Designed to show geographical [contour plots](http://matplotlib.org/examples/pylab_examples/contour_demo.html),
created with [matplotlib/pyplot](https://github.com/matplotlib/matplotlib), as vector layer on interactive slippy maps like [OpenLayers](https://github.com/openlayers/ol3) and [Leaflet](https://github.com/Leaflet/Leaflet).
Demo project that uses geojsoncontour: [climatemaps.romgens.com](http://climatemaps.romgens.com)

## Installation
Install with pip,
```
pip install geojsoncontour
```
## Usage
Use `contour_to_geojson` to create a geojson with contour lines from a `matplotlib.contour` plot (not filled).
Use `contourf_to_geojson` to create a geojson with filled contours from a `matplotlib.contourf` plot.
### Contour plot to geojson
```python
import numpy
import matplotlib.pyplot as plt
import geojsoncontour
# Create contour data lon_range, lat_range, Z
<your code here>
# Create a contour plot plot from grid (lat, lon) data
figure = plt.figure()
ax = figure.add_subplot(111)
contour = ax.contour(lon_range, lat_range, Z, cmap=plt.cm.jet)
# Convert matplotlib contour to geojson
geojson = geojsoncontour.contour_to_geojson(
contour=contour,
ndigits=3,
unit='m'
)
```
For filled contour plots (`matplotlib.contourf`) use `contourf_to_geojson`.
See [example_contour.py](examples/example_contour.py) and [example_contourf.py](examples/example_contourf.py) for simple but complete examples.
### Show the geojson on a map
An easy way to show the generated geojson on a map is the online geojson renderer [geojson.io](http://geojson.io) or [geojson.tools](http://geojson.tools).
### Style properties
Stroke color and width are set as geojson properties following https://github.com/mapbox/simplestyle-spec.
### Create geojson tiles
Try [geojson-vt](https://github.com/mapbox/geojson-vt) or [tippecanoe](https://github.com/mapbox/tippecanoe) if performance is an issue and you need to tile your geojson contours.
## Development
### Tests
Run all tests,
```
python -m unittest discover
```
### Release
Install setuptools, wheel and twine:
```
python -m pip install --upgrade setuptools wheel twine
```
Increase the version number in `setup.py`.
Create dist:
```
python setup.py sdist bdist_wheel
```
Upload:
```
twine upload dist/*
```
%package help
Summary: Development documents and examples for geojsoncontour
Provides: python3-geojsoncontour-doc
%description help
# geojsoncontour
[](https://travis-ci.org/bartromgens/geojsoncontour) [](https://badge.fury.io/py/geojsoncontour) [](https://coveralls.io/github/bartromgens/geojsoncontour?branch=master)
A Python 3 module to convert matplotlib contour plots to geojson. Supports both contour and contourf plots.
Designed to show geographical [contour plots](http://matplotlib.org/examples/pylab_examples/contour_demo.html),
created with [matplotlib/pyplot](https://github.com/matplotlib/matplotlib), as vector layer on interactive slippy maps like [OpenLayers](https://github.com/openlayers/ol3) and [Leaflet](https://github.com/Leaflet/Leaflet).
Demo project that uses geojsoncontour: [climatemaps.romgens.com](http://climatemaps.romgens.com)

## Installation
Install with pip,
```
pip install geojsoncontour
```
## Usage
Use `contour_to_geojson` to create a geojson with contour lines from a `matplotlib.contour` plot (not filled).
Use `contourf_to_geojson` to create a geojson with filled contours from a `matplotlib.contourf` plot.
### Contour plot to geojson
```python
import numpy
import matplotlib.pyplot as plt
import geojsoncontour
# Create contour data lon_range, lat_range, Z
<your code here>
# Create a contour plot plot from grid (lat, lon) data
figure = plt.figure()
ax = figure.add_subplot(111)
contour = ax.contour(lon_range, lat_range, Z, cmap=plt.cm.jet)
# Convert matplotlib contour to geojson
geojson = geojsoncontour.contour_to_geojson(
contour=contour,
ndigits=3,
unit='m'
)
```
For filled contour plots (`matplotlib.contourf`) use `contourf_to_geojson`.
See [example_contour.py](examples/example_contour.py) and [example_contourf.py](examples/example_contourf.py) for simple but complete examples.
### Show the geojson on a map
An easy way to show the generated geojson on a map is the online geojson renderer [geojson.io](http://geojson.io) or [geojson.tools](http://geojson.tools).
### Style properties
Stroke color and width are set as geojson properties following https://github.com/mapbox/simplestyle-spec.
### Create geojson tiles
Try [geojson-vt](https://github.com/mapbox/geojson-vt) or [tippecanoe](https://github.com/mapbox/tippecanoe) if performance is an issue and you need to tile your geojson contours.
## Development
### Tests
Run all tests,
```
python -m unittest discover
```
### Release
Install setuptools, wheel and twine:
```
python -m pip install --upgrade setuptools wheel twine
```
Increase the version number in `setup.py`.
Create dist:
```
python setup.py sdist bdist_wheel
```
Upload:
```
twine upload dist/*
```
%prep
%autosetup -n geojsoncontour-0.4.0
%build
%py3_build
%install
%py3_install
install -d -m755 %{buildroot}/%{_pkgdocdir}
if [ -d doc ]; then cp -arf doc %{buildroot}/%{_pkgdocdir}; fi
if [ -d docs ]; then cp -arf docs %{buildroot}/%{_pkgdocdir}; fi
if [ -d example ]; then cp -arf example %{buildroot}/%{_pkgdocdir}; fi
if [ -d examples ]; then cp -arf examples %{buildroot}/%{_pkgdocdir}; fi
pushd %{buildroot}
if [ -d usr/lib ]; then
find usr/lib -type f -printf "/%h/%f\n" >> filelist.lst
fi
if [ -d usr/lib64 ]; then
find usr/lib64 -type f -printf "/%h/%f\n" >> filelist.lst
fi
if [ -d usr/bin ]; then
find usr/bin -type f -printf "/%h/%f\n" >> filelist.lst
fi
if [ -d usr/sbin ]; then
find usr/sbin -type f -printf "/%h/%f\n" >> filelist.lst
fi
touch doclist.lst
if [ -d usr/share/man ]; then
find usr/share/man -type f -printf "/%h/%f.gz\n" >> doclist.lst
fi
popd
mv %{buildroot}/filelist.lst .
mv %{buildroot}/doclist.lst .
%files -n python3-geojsoncontour -f filelist.lst
%dir %{python3_sitelib}/*
%files help -f doclist.lst
%{_docdir}/*
%changelog
* Wed May 10 2023 Python_Bot <Python_Bot@openeuler.org> - 0.4.0-1
- Package Spec generated
|
